Miya Bholat
Oct 07, 2026
Fleet Maintenance Vendor Scorecard: What to Track

A fleet maintenance vendor scorecard is a repeatable way to evaluate outside repair shops on quality, turnaround, pricing integrity, compliance, and documentation. Instead of choosing vendors mainly on relationships or hourly rates, fleet managers can connect vendor results to broader fleet performance management and decide which shops should receive more work, which need improvement, and which should be replaced.
Key Takeaways
- Score outcomes, not relationships. A consistent scorecard makes vendor decisions easier to defend and repeat.
- Quality deserves heavy attention. Comebacks reveal whether a low repair price actually creates more cost later.
- Credentials belong on the scorecard. Insurance, technician qualifications, and environmental practices reduce hidden operational risk.
- Records are part of vendor performance. A completed repair is not fully closed until usable service documentation comes back to the fleet.
- Vendor type matters. Dealers, independent shops, mobile repair providers, and specialty vendors should not all be judged with identical priorities.
- The score must lead to action. Vendor tiers should affect work allocation, corrective plans, and exit decisions.
Why a Vendor Scorecard Beats Gut Feel
Repair decisions become harder to manage as maintenance costs rise. The American Transportation Research Institute reported in its 2026 operational cost research that repair and maintenance costs increased 8.6 percent in 2025. The same research placed average repair and maintenance cost at 21.5 cents per mile and found the average distance between unscheduled repairs fell from 38,249 miles in 2024 to 36,891 miles in 2025.
That pressure is especially relevant to trucking and logistics fleet operations, where a vendor that produces repeat repairs, slow communication, or incomplete records can affect both vehicle availability and operating cost. A scorecard replaces memory and personal preference with the same evaluation standard for every shop.
What Belongs on a Maintenance Vendor Scorecard
A useful scorecard should group vendor performance into a few decision categories. That makes weaknesses easier to identify than a long list of disconnected metrics.
| Scorecard Category | What to Track | Data Source | Why It Matters |
|---|---|---|---|
| Quality | Comebacks, repeat faults, repair acceptance | Service history, work orders | Shows whether repairs actually hold |
| Turnaround | Completion time, update responsiveness | Work orders, vendor updates | Shows how reliably the shop returns assets |
| Pricing | Estimate accuracy, agreed rates | Estimates, invoices, contracts | Exposes cost drift |
| Safety and compliance | Credentials, insurance, disposal practices | Vendor documents | Reduces qualification and compliance risk |
| Documentation | Complete repair records, parts, labor, dates | Service records, invoices | Preserves usable maintenance history |
Quality and Comeback Rate
Comeback rate is the share of completed repairs that return because the same fault was not resolved correctly. It is one of the clearest indicators of repair quality because it captures work that looked complete but failed in operation. Comparing repeat repairs through vehicle service history records makes this easier to identify across vehicles and vendors.

A cheap repair that creates another shop visit can cost more than a higher initial repair price once added downtime, driver disruption, towing, and administrative effort are considered. Track the trend over multiple jobs instead of judging a shop from one isolated repair.
Turnaround and Responsiveness
Track how long vendors take to return vehicles and whether they communicate when diagnosis, parts availability, or completion dates change. Fleets that need the detailed measurement side can use established vendor repair turnaround and delay metrics rather than rebuilding those calculations inside the scorecard.
For vendor evaluation, the important question is whether the shop repeatedly meets the service expectation set for its type and communicates early when it cannot.
Pricing Integrity and Estimate Accuracy
Compare the approved estimate with the final invoice and check whether contracted labor rates, parts terms, and agreed charges were followed. Large unexplained differences should reduce the vendor score even when the final repair was technically successful.
Detailed invoice auditing should remain a separate process. Use a consistent method for reviewing vendor invoices for billing errors and feed recurring problems back into the vendor score.
Safety, Credentials, and Compliance
Qualification should include technician credentials appropriate to the work, active insurance, and any licenses required by the fleet or jurisdiction. ASE describes its certification program as a national industry credential for automotive service professionals, giving fleets a recognized qualification reference when evaluating repair capabilities.
Environmental practices matter too. EPA used oil standards apply to businesses such as fleet maintenance facilities and vehicle service shops and cover storage, handling, spill response, and certain recordkeeping responsibilities. A vendor that ignores these requirements can introduce risk that is invisible on a repair invoice.
Documentation and Record Handback
A vendor should return enough information to show what failed, what work was completed, which parts were used, when the repair occurred, and what the vehicle may need next. Consistent fleet maintenance work order records make it easier to connect outside work with the fleet's own maintenance history.
For covered commercial vehicles, FMCSA requires records showing inspection, repair, and maintenance activity. Outsourcing the physical repair does not make accurate recordkeeping unimportant, so documentation handback should be treated as a vendor performance requirement.
What to Track Before You Hire vs After You Hire
Pre Award Qualification Criteria
Before sending a vendor any work, score factors that can be verified without repair history. These include technician qualifications, insurance, shop capacity, geographic coverage, references, rate sheets, specialty capabilities, and willingness to return complete documentation.
Keep certificates, insurance records, agreements, and related qualification material in a consistent vehicle document management system or vendor record so expired credentials do not go unnoticed.
Ongoing Performance Metrics
Once work begins, shift attention from promises to results. Review comebacks, turnaround, responsiveness, estimate accuracy, compliance issues, and record handback using the same category structure shown above.
A fleet reports dashboard can help consolidate the underlying maintenance data, but the vendor review should still focus on trends across enough completed jobs to represent normal performance.
Adjust the Scorecard by Vendor Type
The categories can remain consistent while their importance changes. Dealer or OEM shops may deserve more emphasis on specialized repair capability and warranty handling. Independent shops may receive more emphasis on quality, pricing, and capacity. Mobile repair providers need stronger attention to response time, field capability, safety, and documentation. Tire, glass, towing, and other specialty vendors should be evaluated against the service they actually control.
Do not force every provider into an identical scoring model. Fleets that need more detailed scoring mechanics can use the approach for weighting and normalizing scorecard metrics while keeping vendor specific priorities intact.
Score It, Then Act on It: Tiers, Corrective Plans, and Exits
Scoring Without Overcomplicating It
Start with the five core categories and assign simple weights based on operational importance. Then place the result into three performance bands such as preferred, review, and at risk. The goal is not mathematical precision. The goal is a consistent decision standard.
A practical first review can follow this workflow:
- Pull recent jobs. Review roughly 10 to 20 completed jobs for each active vendor when enough volume exists.
- Group vendors by type. Compare dealers with dealers, mobile providers with mobile providers, and specialty shops with similar providers.
- Score each category. Rate quality, turnaround, pricing, compliance, and documentation using evidence from the review period.
- Apply simple weights. Give more influence to the categories that matter most for that vendor type.
- Assign a performance band. Classify the result as preferred, review, or at risk.
- Hold a vendor review. Discuss the underlying jobs and patterns, not just the final score.
- Make an operating decision. Increase volume, keep volume steady, require corrective action, or move the work elsewhere.
Vendor Tiers and Volume Allocation
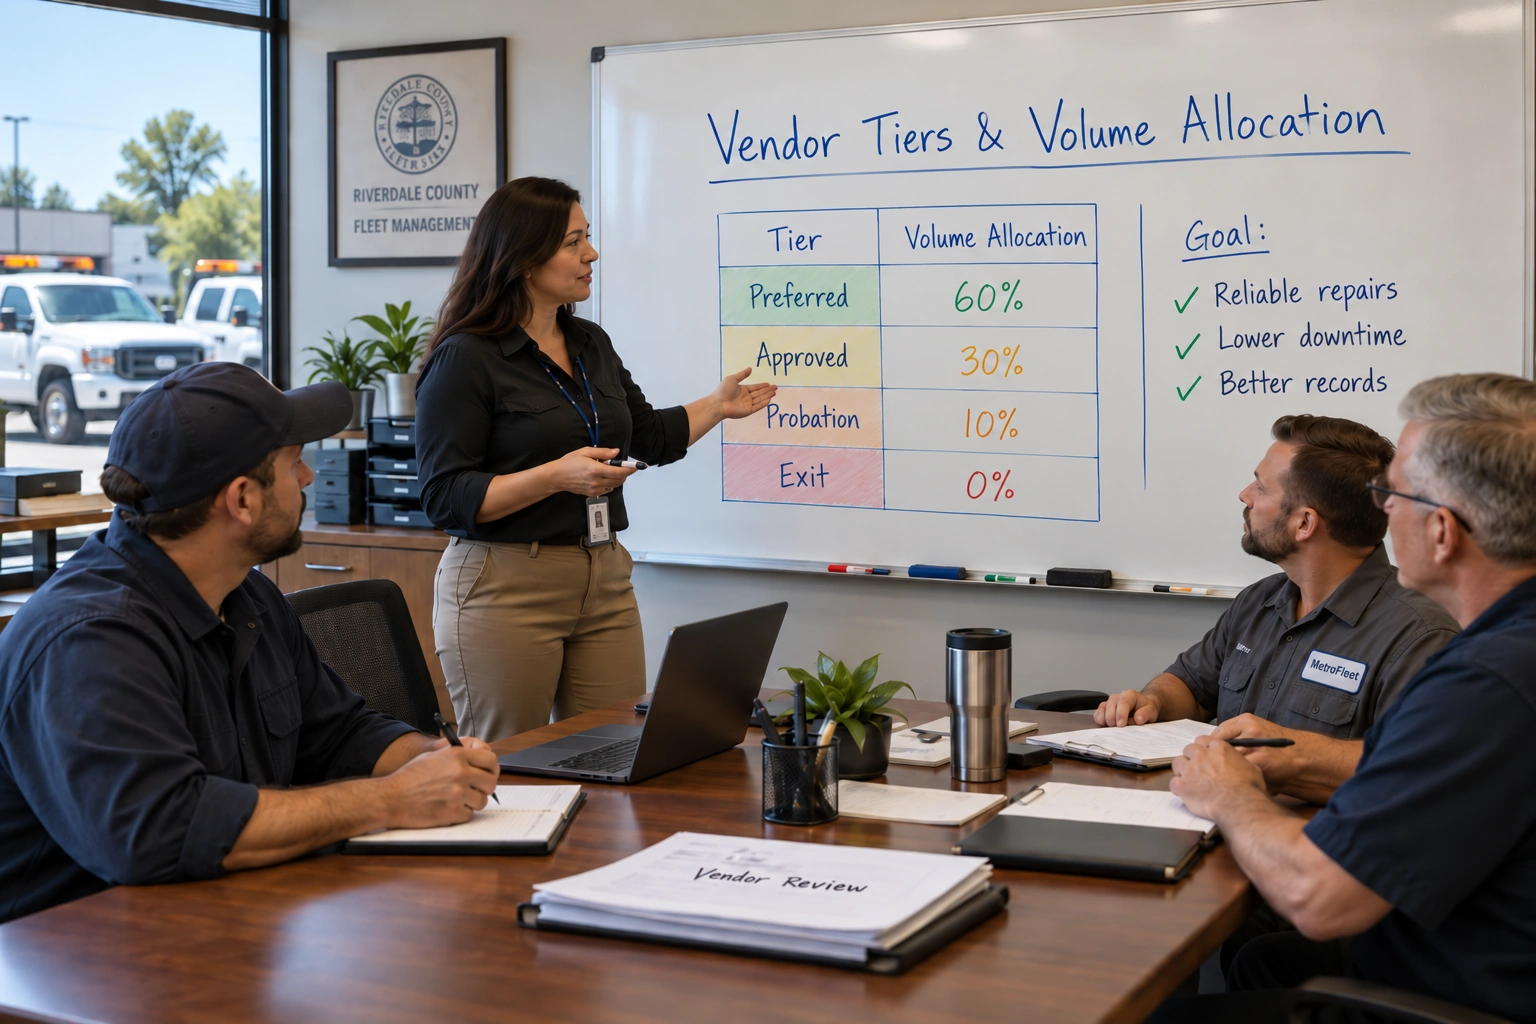
Translate the score into operational tiers such as preferred, approved, probation, and exit. Preferred vendors earn more suitable work because they have demonstrated reliable performance. Approved vendors remain usable but may not receive priority volume. Probation vendors need documented improvement before receiving additional work.
Tiering also prevents a familiar vendor from continuing to receive work automatically when another shop is producing better outcomes.
Corrective Action vs Exit
A weak score does not always require immediate replacement. A vendor may deserve a corrective plan when the problem is measurable, recent, and realistically fixable, such as poor status updates or incomplete record handback.
Exit becomes more reasonable when the same quality, compliance, billing, or documentation problem continues after it has been raised, especially when it creates safety risk or repeated vehicle downtime.
Vendor Scorecard Mistakes That Skew Your Results
Several common mistakes can make a vendor score look more objective than it really is:
- Scoring mostly on price while ignoring repair quality.
- Comparing different vendor types with identical priorities.
- Ignoring comebacks and repeat faults.
- Overreacting to one bad repair instead of looking for a trend.
- Allowing missing service records to count as completed work.
- Collecting scores without changing vendor volume or status afterward.
Frequently Asked Questions
-
What should I check before approving a fleet maintenance vendor?
Check repair capabilities, technician qualifications, insurance, capacity, communication process, pricing, references, and how the vendor handles repeat repairs and service records. -
What counts as a comeback in fleet maintenance?
A comeback is when a vehicle returns for the same or closely related problem after a repair. Track it consistently within a defined period so vendors are measured by the same standard. -
How often should fleet maintenance vendors be reviewed?
Review high volume vendors monthly or quarterly. Lower volume vendors may need a longer review period so you have enough completed repairs to judge performance fairly. -
Should all maintenance vendors use the same scorecard?
Use the same core categories, but adjust their importance by vendor type. A mobile repair provider, dealer, tire vendor, and general repair shop do not control the same parts of the maintenance process. -
When should I replace a poorly performing maintenance vendor?
Consider replacement when repeated quality, compliance, billing, communication, or documentation problems continue after corrective action. Safety risks or persistent comebacks may justify a faster exit.