Miya Bholat
Aug 07, 2026
Preventive Maintenance Data Fleets Should Record

Fleets should record the asset identity, service date, odometer or engine hours, measured condition, defects found, tasks completed, labor, parts, total cost, downtime, technician, and approval status during every preventive maintenance event. Capturing these fields in fleet maintenance software turns a completed service into evidence that helps managers schedule the next visit, control costs, prove repairs, spot recurring failures, and decide when an asset should be replaced.
Key Takeaways
- A completion date is only the starting point. Useful PM data explains what technicians found, measured, replaced, and spent.
- Usage readings protect interval accuracy. Odometer, engine hours, idle hours, and operating time show when the next service is truly due.
- Measured condition reveals trends. Brake, tire, belt, and fluid observations help teams act before gradual wear becomes failure.
- Task level cost data improves decisions. Labor, parts, fees, and downtime expose expensive assets, vendors, and recurring repairs.
- Defect linkage supports compliance. Connecting an inspection finding to a repair and signoff creates a traceable corrective action record.
- Consistent fields make lifecycle analysis possible. Fleets need comparable data across many PM events before repair or replacement patterns become reliable.
Why Most Fleets Record PM Completion but Miss the Data That Matters
A checked box confirms that someone completed a service. It does not show whether brake pads were close to their limit, whether the same belt needed attention twice, or whether one vendor took twice as long as another. Fleets that capture only a date and invoice cannot explain why costs changed or which issue deserves action next.

The gap has an operational cost. MapTrack fleet management data for 2026 reports that fleets without digital maintenance systems average 40% to 55% reactive maintenance, compared with 15% to 20% for fleets using a CMMS or fleet platform. The value of PM is not the checkbox. It is the decision ready data produced during the event.
Vehicle and Asset Data to Record at Every PM Event
Odometer, Engine Hours, and Usage Metrics
Record the exact odometer and engine hour reading when service begins, along with the date and asset ID. For vehicles that idle heavily or power auxiliary equipment, engine hours may reveal wear that mileage misses. Accurate readings also make preventive maintenance checklists and schedules more dependable because the next interval starts from a verified baseline.
Usage data supports two decisions. First, it shows how much service life remains before the next task. Second, it helps compare maintenance cost with actual use. A truck with low mileage but high engine hours should not be judged by mileage alone.
Vehicle Condition Notes and Defect Findings
Technicians should record measurements and observations, not just pass or fail. A consistent digital vehicle inspection process makes gradual deterioration visible across service events.
The most useful condition fields include:
- Brake pad or lining measurement by wheel position
- Tire tread depth and pressure by tire position
- Fluid level, color, contamination, and leak location
- Belt and hose wear, cracks, tension, and softness
- Battery condition, fault codes, and unusual noise or vibration
A brake reading that declines at each PM gives the fleet time to plan parts and labor. A plain note saying brakes checked does not.
Service and Labor Data That Drives Cost Decisions
Task Level Labor Hours and Technician ID
Record the technician or vendor, start and finish time, task performed, and labor hours for each task. A fleet maintenance work order should separate inspection time, routine service, and corrective repair instead of combining everything into one labor total.
This data helps managers compare shop capacity, outside vendor speed, and standard job times. It also supports warranty claims by showing who completed the work, what they did, and when they did it.
Parts Used, Part Numbers, and Vendor Source
For every installed part, record the description, part number, quantity, unit cost, supplier, warranty status, and vehicle position when relevant. Connecting service records with parts inventory management prevents the team from ordering a similar but incompatible component.
Granular parts data also answers practical questions. Which filters should the shop stock? Which supplier has the highest return rate? Is the same component failing repeatedly on one vehicle class? Without part numbers and sources, those patterns remain hidden inside invoices.
Total Service Cost per PM Event
Roll labor, parts, fluids, taxes, outside shop fees, towing, and downtime into one event total. Do not rely only on a monthly fleet average. A fleet reporting dashboard can then compare equivalent PM events by vehicle, class, location, and vendor.
Use this cost structure for every event:
- Internal labor cost
- External labor and shop fees
- Parts, fluids, and consumables
- Towing or transport cost
- Downtime hours and estimated operational impact
The event view shows whether a routine service is becoming more expensive over time, even when the overall fleet average looks stable.
Compliance and Inspection Data Fleets Often Skip
DVIR Defect to Repair Linkage
When a driver reports a defect, record the original inspection ID, defect description, severity, vehicle status, related work order, repair date, technician, verification, and final signoff. Strong preventive maintenance inspection practices create a continuous chain from discovery to resolution.

That chain matters during an audit. FMCSA vehicle inspection requirements say an out of service defect must be corrected before the vehicle returns to operation, and carriers must retain required inspection documentation. A 2026 Heavy Vehicle Inspection review reported that about 22.6% of trucks inspected during the 2025 International Roadcheck were placed out of service. The risk is not just finding a defect. It is failing to prove that the defect was corrected.
PM Schedule Adherence Records
Record the due date or usage threshold, actual completion date, status as early, on time, or overdue, days or miles of variance, reason for delay, and approving manager. Schedule adherence reveals whether missed PM is an isolated exception or a recurring control problem.
Auditors and insurers may look for a pattern of reasonable maintenance control. A complete vehicle service history shows both the work performed and whether the fleet followed its own schedule.
Data That Feeds Repair vs Replace and Lifecycle Decisions
One PM record rarely justifies replacing a vehicle. A sequence of records can. Track cumulative maintenance cost, cost per mile or hour, repeat defects, downtime frequency, days unavailable, major component work, and condition changes. Together, these fields show whether reliability is recovering after repairs or continuing to decline.
The financial difference can be substantial. OxMaint preventive maintenance benchmarks place reactive work at 3 to 9 times the cost of planned maintenance. A published fleet service benchmark places unplanned maintenance around $1,200 to $2,800 per incident, compared with roughly $400 to $800 for scheduled work. Actual costs vary by vehicle, repair, and downtime exposure.
Reviewing ways to reduce reactive fleet maintenance alongside asset level PM trends helps managers distinguish one unusual repair from a worsening pattern. Without those data points, fleets may replace a sound vehicle after one expensive event or keep an unreliable vehicle long after its operating value has fallen.
| Data field | Pattern to watch | Decision enabled |
|---|---|---|
| PM cost per event | Rising cost across similar services | Review vendor, scope, or asset condition |
| Repeat defect code | Same issue across several events | Diagnose root cause or claim warranty |
| Downtime frequency | More service interruptions each quarter | Reassign, rebuild, or replace asset |
| Cost per mile or hour | Cost rises while utilization falls | Compare repair cost with replacement value |
| Condition measurements | Wear accelerates between services | Shorten interval or plan component replacement |
Common PM Data Gaps and What They Cost You
Use the following list as a quick audit of each PM form or work order:
- No odometer or engine hours: The next service interval may be inaccurate, and cost per use cannot be calculated.
- No technician or vendor ID: The fleet cannot compare productivity, workmanship, or vendor performance.
- No measured condition notes: Gradual wear remains invisible until it causes a defect or failure.
- No part number or part cost: Warranty recovery, correct reordering, and stocking decisions become harder.
- No defect to repair reference: The fleet may be unable to prove that a reported safety issue was resolved.
- No downtime or event cost: Budget forecasts understate the real impact of maintenance.
If one field is missing occasionally, correct the process. If it is missing across most events, do not trust reports that depend on it until the fleet establishes a reliable baseline.
How to Start Capturing Better PM Data Without Slowing Down Your Team
Start with required fields that directly support a decision.
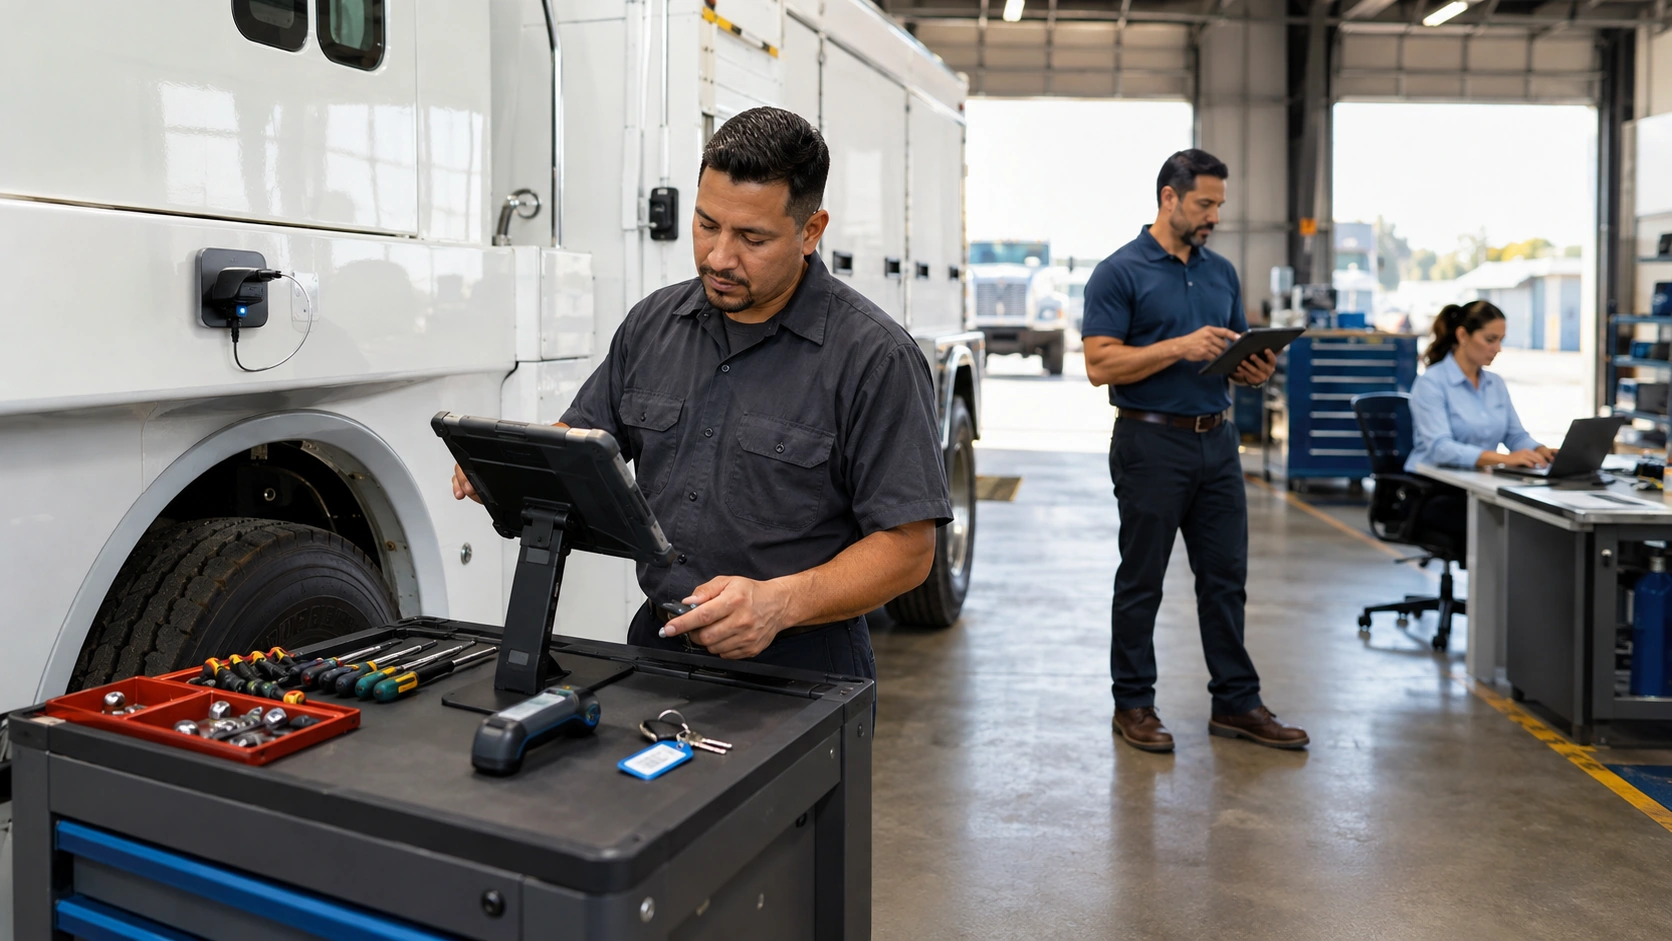
AUTOsist can connect PM scheduling, work orders, digital inspections, service history, and parts records so the team captures information as work happens instead of reconstructing it later.
A practical PM data workflow is:
- Trigger the event. Use a date, mileage, engine hour, or condition threshold through fleet preventive maintenance scheduling.
- Verify the asset and usage. Capture the vehicle ID, odometer, engine hours, location, and service start time.
- Inspect and measure. Require condition readings, defect severity, notes, and photos where they add evidence.
- Record the work. Log each task, technician, labor time, part, cost, and vendor.
- Close the loop. Link defects to repairs, obtain signoff, calculate downtime, and set the next due threshold.
- Review exceptions. Flag overdue PM, repeat defects, unusual cost, and worsening measurements.
Automatic usage capture reduces typing and errors. GPS tracking and telematics data can supply mileage or engine hour readings to maintenance reminders.
Spytec fleet statistics for 2026 cite an ABI Research estimate that telematics based reminders reduce overall maintenance costs by about 14%. The US Department of Energy maintenance practices report also estimates that preventive programs can save 12% to 18% compared with reactive maintenance. Results vary, but clean data lets a fleet measure its own outcome instead of relying on an industry average.
Frequently Asked Questions
-
What data should be recorded during fleet preventive maintenance?
Record the asset ID, date, odometer or engine hours, condition measurements, defects, tasks, labor, technician, parts, costs, downtime, approvals, and next service threshold. Each field should support a scheduling, cost, safety, or lifecycle decision. -
How does PM data help with DOT compliance?
PM data can show when a defect was reported, how it was assessed, which work order corrected it, who verified the repair, and when the vehicle returned to service. That traceable chain is stronger evidence than a completion date alone. -
What is the difference between tracking PM completion and tracking PM data?
Completion tracking answers whether service happened. PM data explains what technicians measured, found, replaced, spent, and approved, giving managers evidence for the next decision. -
How do fleets use maintenance data for vehicle replacement decisions?
Fleets compare cost per mile or hour, repeat defects, downtime, major repairs, and worsening condition across multiple events. A rising pattern can show when continued repair is less practical than replacement or reassignment. -
What PM data fields do most fleets skip?
Common omissions include technician ID, task level labor, odometer at service, measured condition, part numbers, downtime, and defect signoff. Skipping them weakens vendor comparisons, forecasts, warranty claims, and compliance evidence.