Miya Bholat
Mar 24, 2026
How to Reduce Fleet Idle Time and Improve Vehicle Utilization
Key Takeaways: Turning Idle Time Reduction into a Lasting Habit
- Idle time is a measurable cost, not a minor inefficiency. Even small amounts of daily idle can translate into tens of thousands in annual fuel waste.
- Not all idle time is bad — but wasteful idle must be eliminated. Understanding the difference is critical before taking action.
- Tracking idle rate is the foundation of improvement. Without data from telematics or fuel analysis, idle reduction becomes guesswork.
- Driver behavior and operational inefficiencies require different solutions. Policies fix habits; better planning fixes systemic issues.
- Technology makes accountability scalable. Systems like telematics and reporting dashboards turn idle time into a visible, manageable metric.
- Idle time and utilization are deeply connected. High idle often signals underused vehicles or inefficient deployment.
- Sustainable improvement comes from consistency. Fleets that track, review, and act on idle data continuously see long-term gains.
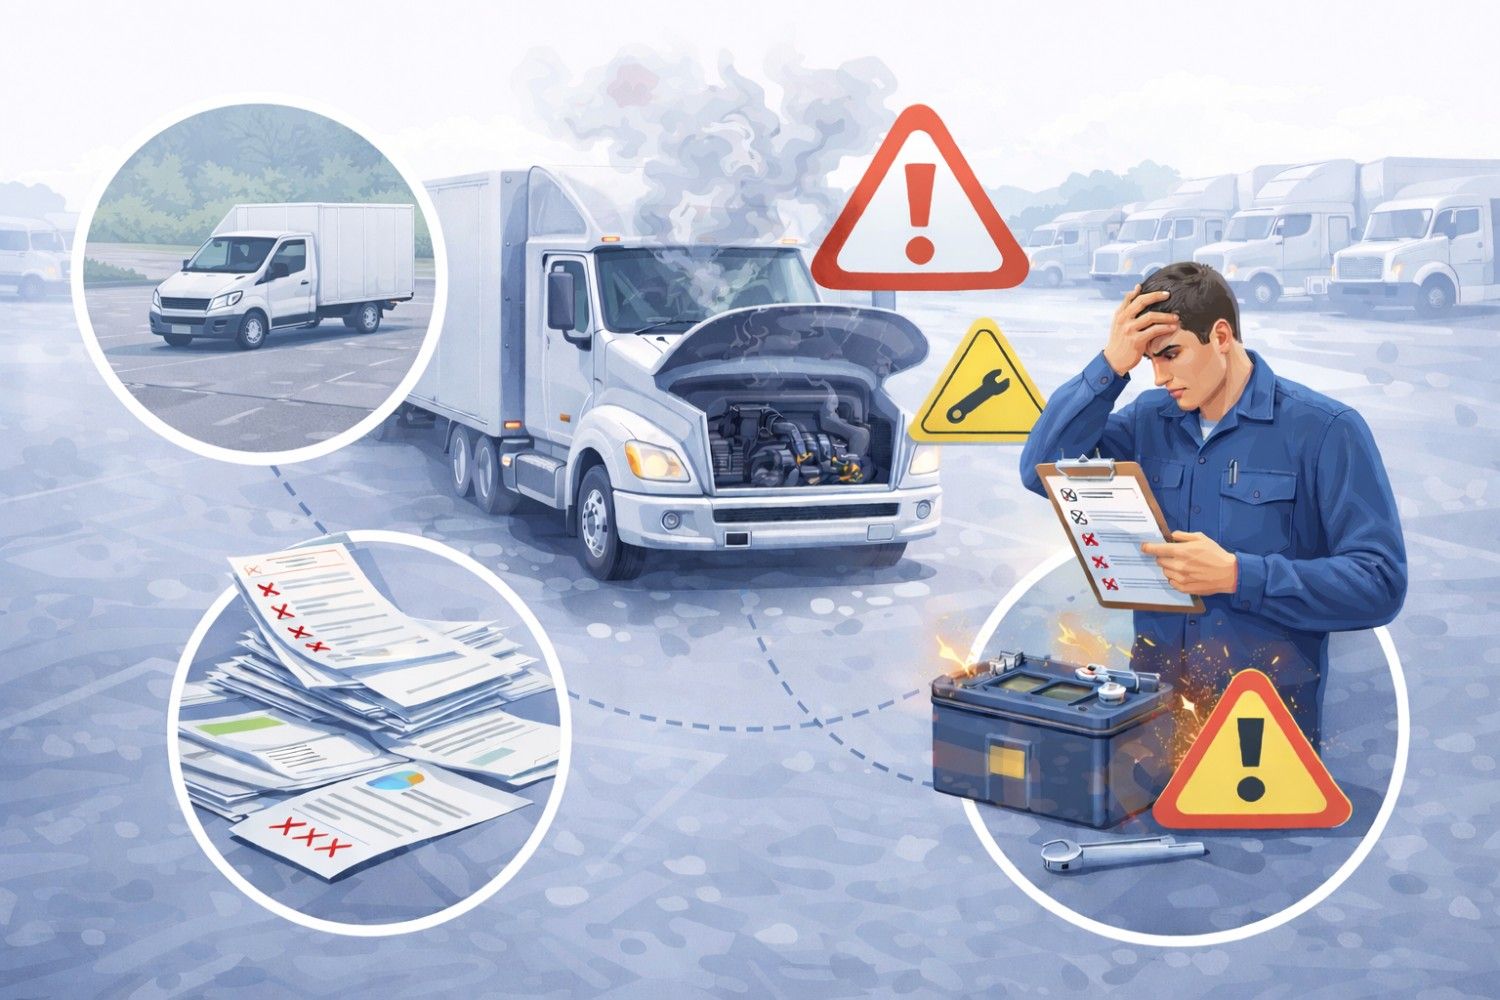
Idle Engines Are Burning Money - Here's How Much
Idle time looks harmless. Engines are running, vehicles are ready, nothing appears broken. But financially, idle time is one of the fastest ways to drain your fleet budget.
A diesel engine burns ~0.8 gallons per hour while idling. Let's run a simple example:
- 20 vehicles
- 2 hours of idle time per day
- 250 working days per year
- Diesel cost: $4 per gallon
Calculation:
- 0.8 gallons × 2 hours = 1.6 gallons/day per vehicle
- 1.6 × 20 vehicles = 32 gallons/day
- 32 × 250 days = 8,000 gallons/year
- 8,000 × $4 = $32,000 annually
Now scale that to a 50-vehicle fleet — you're looking at $80,000+ per year burned without moving a single mile.
That's fuel only. It doesn't include:
- Increased engine wear
- More frequent maintenance intervals
- Reduced asset lifespan
- Higher emissions compliance risk
Idle time isn't just inefficiency — it's a direct cost center.
What Counts as Idle Time (and What Doesn't)
Not all idle time is equal. Treating it as one category leads to poor decisions and unrealistic expectations.
You need to separate idle time into three types:
- Unavoidable idle: PTO usage, safety-related HVAC, traffic congestion
- Manageable idle: Waiting at job sites, extended warm-up periods
- Wasteful idle: Driver habits, poor dispatching, lack of policy enforcement
The goal isn't zero idle — it's eliminating unnecessary idle.
How to Calculate Your Fleet's Idle Rate
Idle rate is the percentage of time engines run without movement.
Formula:
Idle Hours ÷ Total Engine Hours × 100
Example:
- 300 idle hours ÷ 1,000 total engine hours = 30% idle rate
Benchmarks vary by fleet type, but generally:
- 15–25% → Efficient operations
- 25–40% → Common industry range
- 40%+ → Clear inefficiency and cost leakage
If you're above 35–40%, you likely have both behavioral and operational issues to fix.
Why Fleet Idle Time Gets Out of Control
Idle time rarely spikes because of a single issue. It builds from multiple small inefficiencies across your operation.
The most common causes include:
- Lack of visibility into vehicle data — no real tracking of engine-on vs. movement
- No defined idle policy — drivers operate based on habit
- Inefficient routing and dispatch — unnecessary waiting between stops
- Driver behavior patterns — engines left running during breaks
- Workflow bottlenecks — crews waiting at job sites with engines on
Many fleets underestimate how much of their idle time is systemic, not individual.
The Role of Driver Behavior vs. Operational Inefficiency
You need to separate who owns the problem:
- Driver-driven idle: Leaving engines on during downtime, excessive warm-ups
- Operational idle: Poor scheduling, site delays, inefficient routes
Driver issues are solved with:
- Policy
- Training
- Accountability
Operational issues are solved with:
- Better routing
- Smarter dispatch
- Workflow redesign
Treating both the same leads to frustration and no measurable improvement.
How to Actually Measure Idle Time Across Your Fleet
You can't reduce what you don't measure. Idle time becomes actionable only when it's visible.
There are several reliable data sources:
- Telematics and GPS systems — engine-on vs. movement tracking
- ELD data — engine hours, idle logs, compliance records
- Fuel reports — spikes in consumption without mileage increase
- Maintenance data — excessive engine wear indicators
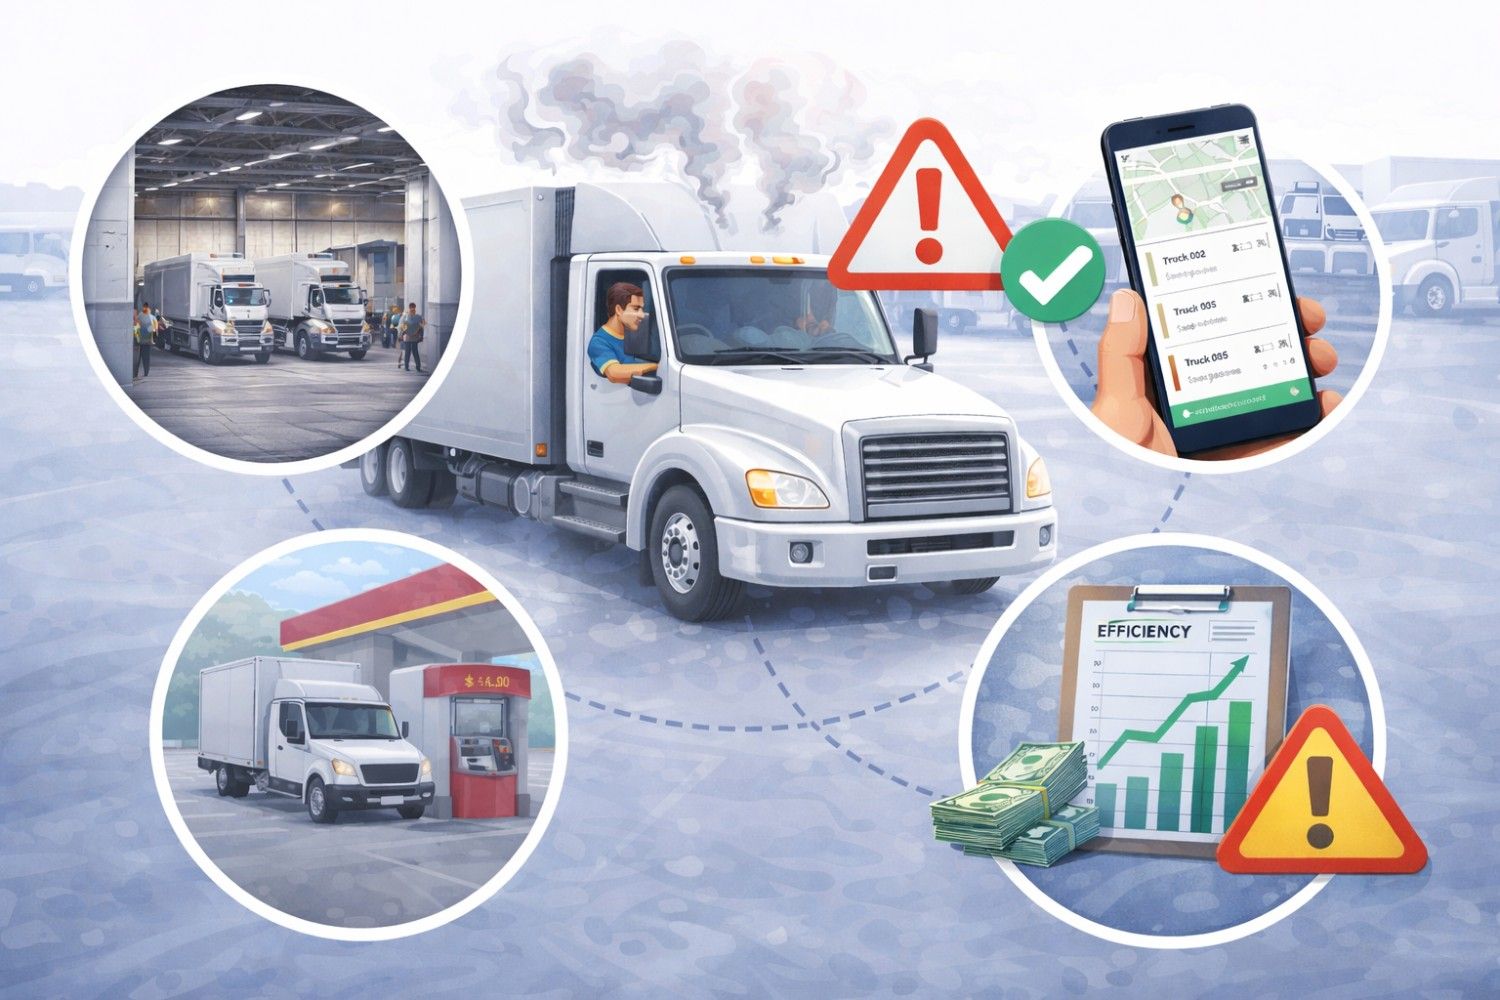
Modern systems like fleet GPS tracking software allow you to track idle time automatically across all vehicles, without manual logging.
If your fleet doesn't yet use telematics:
- Start with fuel consumption vs. mileage analysis
- Use manual driver logs as a temporary baseline
- Identify obvious outliers (vehicles consuming more fuel per mile)
But manual tracking doesn't scale. At some point, visibility requires technology.
Practical Strategies to Reduce Idle Time Without Disrupting Operations
Once you have data, the next step is action. The key is implementing strategies that reduce idle time without slowing down operations.
Here are proven approaches fleets use:
- Idle shutdown policies with clear thresholds (e.g., 3–5 minutes)
- Driver scorecards tied to idle performance
- Route optimization to reduce wait time between stops
- Auxiliary power units (APUs) for climate control without engine use
- Pre-job planning to eliminate unnecessary on-site idle
Each strategy targets a different root cause — and works best when combined.
Setting an Idle Policy That Drivers Will Actually Follow
A policy only works if drivers follow it consistently.
Effective idle policies include:
- A clear threshold (commonly 3–5 minutes)
- Defined exceptions (safety, PTO, extreme weather)
- Real-time visibility into driver performance
- Regular feedback, not just penalties
The biggest shift happens when drivers know idle time is tracked.
With tools like fleet reporting dashboards , managers can share data transparently — and behavior changes quickly when performance is visible.
Using Telematics Data to Identify Your Worst Offenders
Idle reduction becomes easy when you know exactly where to focus.
Use your data to:
- Rank drivers by total idle hours
- Identify vehicles with highest idle percentage
- Spot patterns (same routes, same time of day)
- Compare expected vs. actual idle time
Instead of general warnings, you can have specific, data-backed conversations.
That's the difference between "reduce idle time" and "Vehicle #23 idled 2.5 hours daily last week."
The Connection Between Idle Time and Vehicle Utilization
Idle time is only part of the bigger picture. It often signals deeper utilization problems.
A vehicle that idles excessively is usually:
- Underutilized
- Poorly assigned
- Scheduled inefficiently
- Or unnecessary in the fleet
Utilization measures how effectively vehicles are used relative to their availability.
To understand this better, fleets often track vehicle utilization metrics alongside idle time. A deeper breakdown can be found in this guide on fleet utilization rate tracking .
Typical utilization indicators include:
- Miles driven per day
- Engine hours vs. available hours
- Jobs completed per vehicle
Low utilization + high idle = excess capacity or poor planning
Right-Sizing Your Fleet Based on Utilization Data
Many fleets carry extra vehicles simply because they've never measured utilization properly.
Utilization data can reveal:
- Vehicles consistently underused
- Redundant capacity in specific regions
- Opportunities to consolidate routes
In some cases, improving dispatch and reducing idle time allows fleets to:
- Delay new vehicle purchases
- Reduce total fleet size
- Increase ROI on existing assets
This is where idle reduction directly impacts long-term capital planning.
Reducing idle time isn't a one-time fix it's an operational discipline. The fleets that treat it as a measurable KPI, not a side issue, are the ones that consistently lower costs and improve utilization over time.