Miya Bholat
Feb 11, 2026
How to Standardize Fleet Operations Across Locations: Tools, SOPs, and KPIs
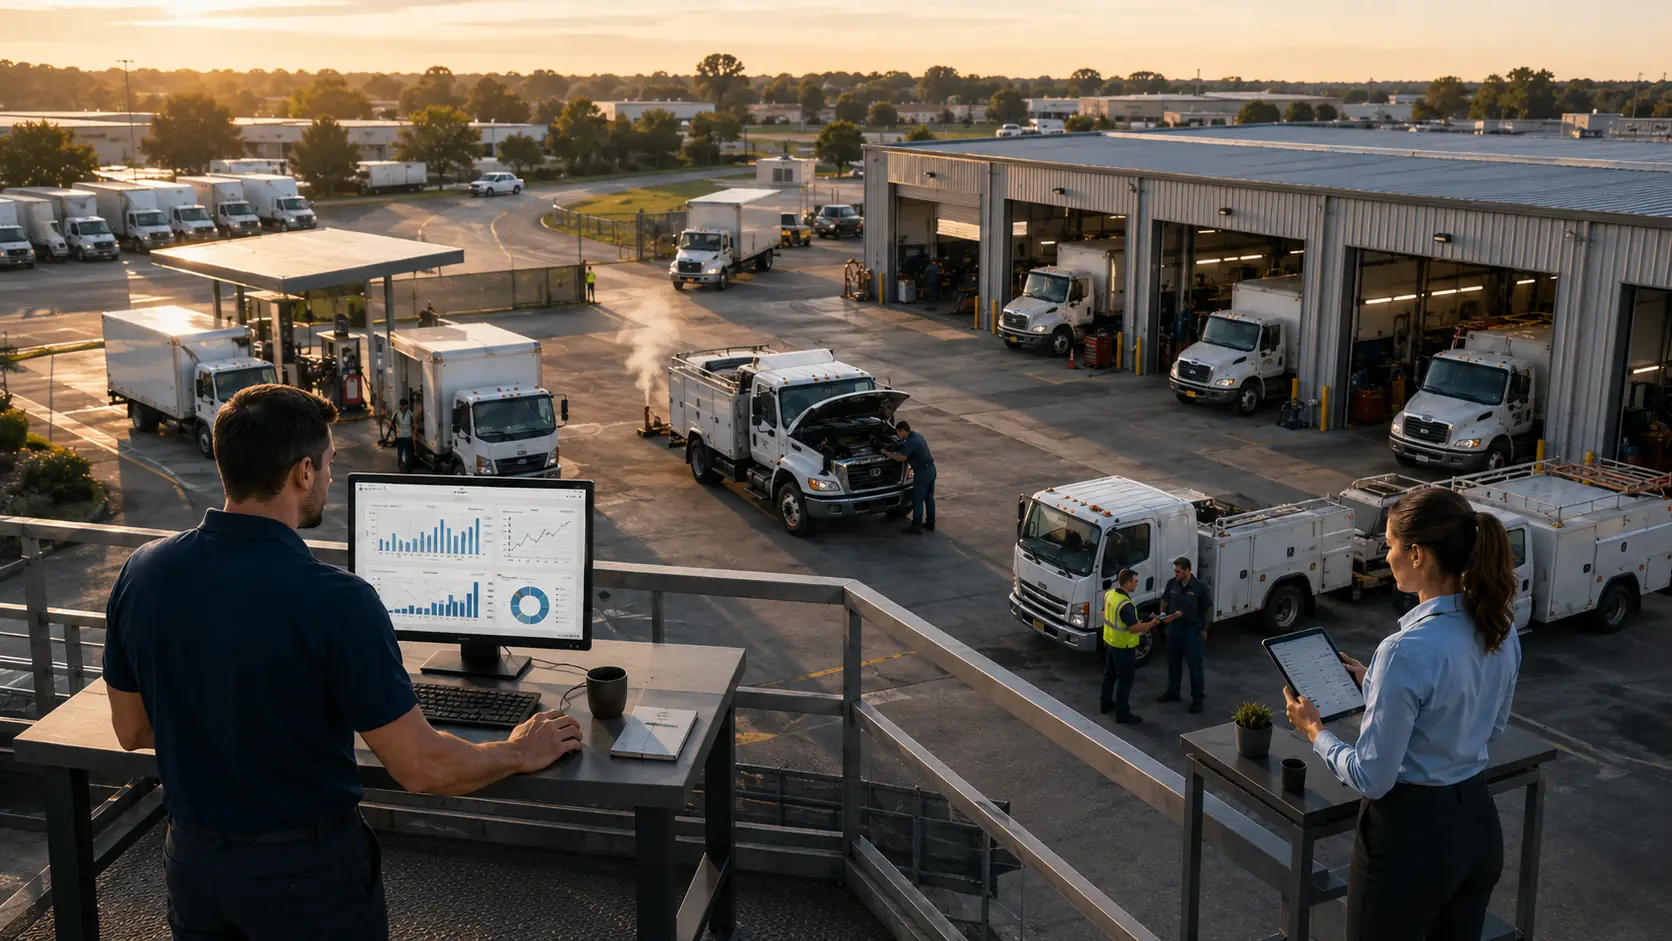
Fleet operations standardization is the process of creating consistent maintenance intervals, inspection workflows, repair approval thresholds, and reporting formats across every location in a multi-site fleet, so that vehicle performance and operating costs are predictable regardless of geography. For multi-location fleets specifically, standardization is the foundation of fleet performance management: without consistent processes, cost-per-location comparisons are meaningless, compliance audits become location-by-location fire drills, and scale multiplies problems rather than efficiency.
This guide covers the tools and platforms that enforce standardization automatically, the SOPs that define what gets standardized, and the KPIs that confirm whether standardization is working. The structure follows the three layers every multi-location fleet needs: process design, technology enforcement, and measurement.
Key Takeaways: Building a Unified Fleet Operation
- Standardization reduces cost variance: Consistent maintenance intervals and repair approvals prevent location-specific overspending and stabilize cost per mile across branches.
- Shared documentation improves compliance: Uniform records make audits faster and reduce legal and regulatory risk across jurisdictions.
- Technology enforces consistency automatically: Automated schedules and centralized dashboards remove manual variation and human error.
- Team buy-in determines long-term success: Training and communication matter as much as SOP design. Without adoption, even perfect processes fail.
- KPIs reveal whether alignment works: Tracking downtime, compliance, and repair costs across locations confirms whether standardization delivers measurable improvements.
Why Fleet Standardization Matters More Than You Think
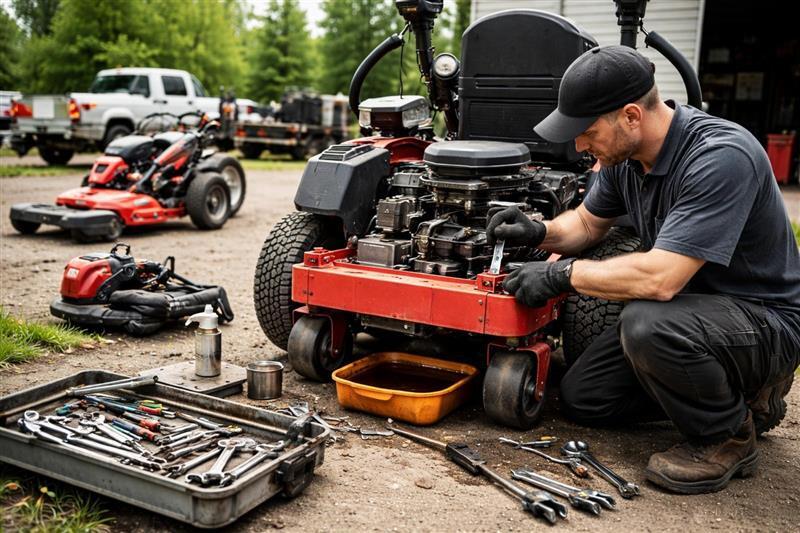
When every branch or location manages vehicles differently, hidden costs start stacking up. One shop replaces brake pads at 40% wear, another waits until metal-on-metal. One location logs inspections daily, another only before audits. These small differences don’t look dangerous at first, but across 50 or 500 vehicles, inconsistency becomes expensive.
Fleet standardization isn’t just about neat documentation. It directly impacts operating expenses, safety performance, and how quickly a company can grow into new territories. Without standardized processes, scaling a fleet often means multiplying problems rather than multiplying efficiency. You end up with unpredictable maintenance outcomes, compliance gaps, and wildly different cost per mile figures between cities.
Consider a fleet operating in three states. If maintenance intervals vary by 2,000 miles between locations, annual repair costs can differ by 20–30% even with identical vehicles. The business doesn’t just lose money. It loses predictability. Predictability is what allows leaders to budget accurately, forecast downtime, and make confident expansion decisions.
Common Pain Points of Multi-Location Fleet Management
Inconsistent Maintenance Schedules and Procedures
This is the most visible issue. One location changes oil every 3,000 miles, another at 5,000, and a third relies on driver memory. The result is uneven wear, unplanned breakdowns, and vehicles that perform differently despite being the same make and model. Preventive maintenance works only when it’s consistent. Without uniform intervals, you can’t reliably compare performance or identify systemic issues.
Communication Breakdowns Between Teams
Teams in different cities often operate in silos. A technician in Dallas may discover a recurring transmission issue, but the Chicago branch never hears about it. Valuable knowledge gets trapped locally instead of becoming a company-wide improvement. Over time, this lack of communication creates duplicated mistakes and missed optimization opportunities.
Data Silos and Reporting Challenges
When each location uses separate spreadsheets, paper logs, or different digital tools, leadership struggles to get a single source of truth. Comparing downtime or repair spend becomes guesswork. Decisions rely on partial data rather than complete visibility, which weakens strategic planning and budgeting.
The Core Elements of Standardized Fleet Operations
Standardization doesn’t mean rigidity. It means building a shared operational language so every location follows the same baseline rules while still allowing minor regional flexibility.
A strong standardized fleet typically aligns around the following components:
- Maintenance intervals and service triggers based on mileage, engine hours, or OEM schedules
- Inspection checklists that remain identical across locations
- Repair approval thresholds to prevent unauthorized or inconsistent spending
- Parts inventory rules so common components remain available everywhere
- Reporting formats that leadership can compare without translation
Unified Maintenance Protocols
This ensures every vehicle follows the same preventive schedule regardless of geography. Unified protocols reduce unexpected breakdowns and make performance comparisons accurate. They also simplify technician training because expectations remain identical across branches.
Consistent Documentation Requirements
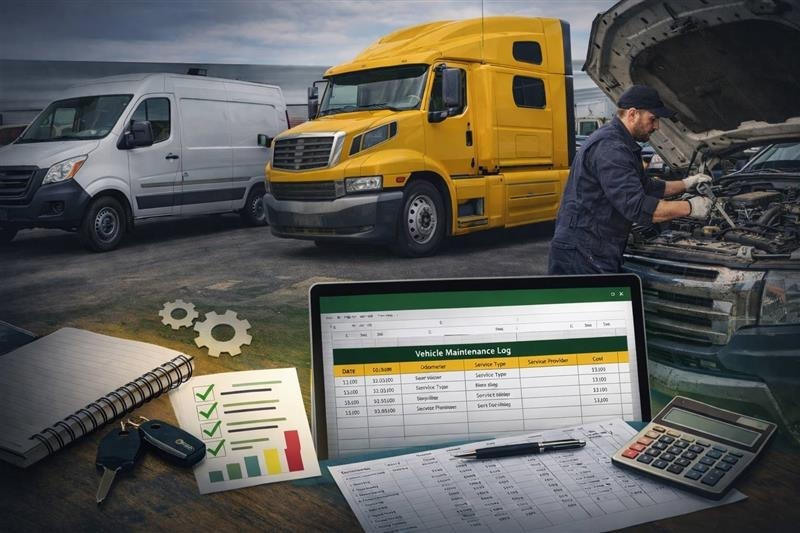
Whether it’s a work order, inspection report, or compliance certificate, documentation should follow one structure. This consistency accelerates audits and reduces legal risk. It also ensures that historical vehicle data remains usable long-term.
Standardized Vendor Management
Different locations often choose their own repair vendors, which leads to inconsistent pricing and quality. Standardization allows companies to negotiate better rates, track vendor performance, and maintain uniform service standards.
Universal Performance Metrics
Every location should measure success the same way. Metrics like cost per mile, downtime hours, and inspection compliance rates should follow one formula company-wide. Without this, benchmarking becomes meaningless.
Tools That Help Fleets Standardize PM Schedules Across Locations
Fleet management software standardizes PM schedules across locations by applying a single set of maintenance triggers (mileage thresholds, engine-hour counts, or calendar dates) to every vehicle in the fleet, regardless of where that vehicle is based. When a vehicle at any location hits the defined threshold, the platform automatically generates a service reminder and work order, so the maintenance interval is enforced consistently without any manual follow-up from local managers.
The tools that do this most effectively share three capabilities: centralized schedule configuration (one manager sets the intervals once and they apply fleet-wide), location-level visibility (branch managers see upcoming and overdue services for their vehicles only), and cross-location reporting (leadership compares PM compliance rates by branch to identify which locations are lagging). Platforms that require each location to set its own schedules independently do not solve the standardization problem; they replicate the same fragmentation in a digital format. Platforms designed for multi-location fleets, such as the fleet preventive maintenance schedules and reminders tools that automate these triggers, remove the configuration burden from each branch entirely.
Industry data from a 2026 multi-site fleet case study found that a contractor operating 156 assets across 20 job sites improved fleet-wide PM compliance from 54 percent to 84 percent after moving to centralized PM scheduling, and prevented over $200,000 in unnecessary equipment transfers by eliminating the asset visibility gap that caused duplicate rentals. For fleet managers building a cross-location monitoring framework around compliance and cost data, fleet performance monitoring covers the KPI structure and reporting cadence in detail.
How to Build Standard Operating Procedures (SOPs) for Fleet Maintenance
Creating SOPs sounds complex, but it becomes manageable when approached step by step. The goal isn’t to produce a thick manual no one reads. The goal is to create living documents that technicians and managers actually use.
Before drafting SOPs, it helps to identify which operational areas will benefit most from immediate alignment:
- Preventive maintenance intervals
- Inspection and defect reporting workflows
- Work order approval processes
- Parts inventory tracking
- Compliance documentation procedures
Start With Your Most Critical Assets
Focus first on high-value or high-risk vehicles, delivery trucks, service vans, emergency units. Standardizing these assets produces the biggest financial and safety impact quickly.
Document Current Best Practices From All Locations
Instead of forcing one branch’s process onto others, gather input from each team. Often, one location excels at inspections while another has superior inventory control. Combining strengths leads to more practical SOPs.
Create Templates and Checklists
Templates turn SOPs into daily tools rather than theoretical guidelines. Inspection forms, maintenance logs, and approval workflows should be easy to follow and quick to complete. Many fleets use resources like the Fleet Maintenance SOP Guide to accelerate this process.
Technology’s Role in Enforcing Consistency
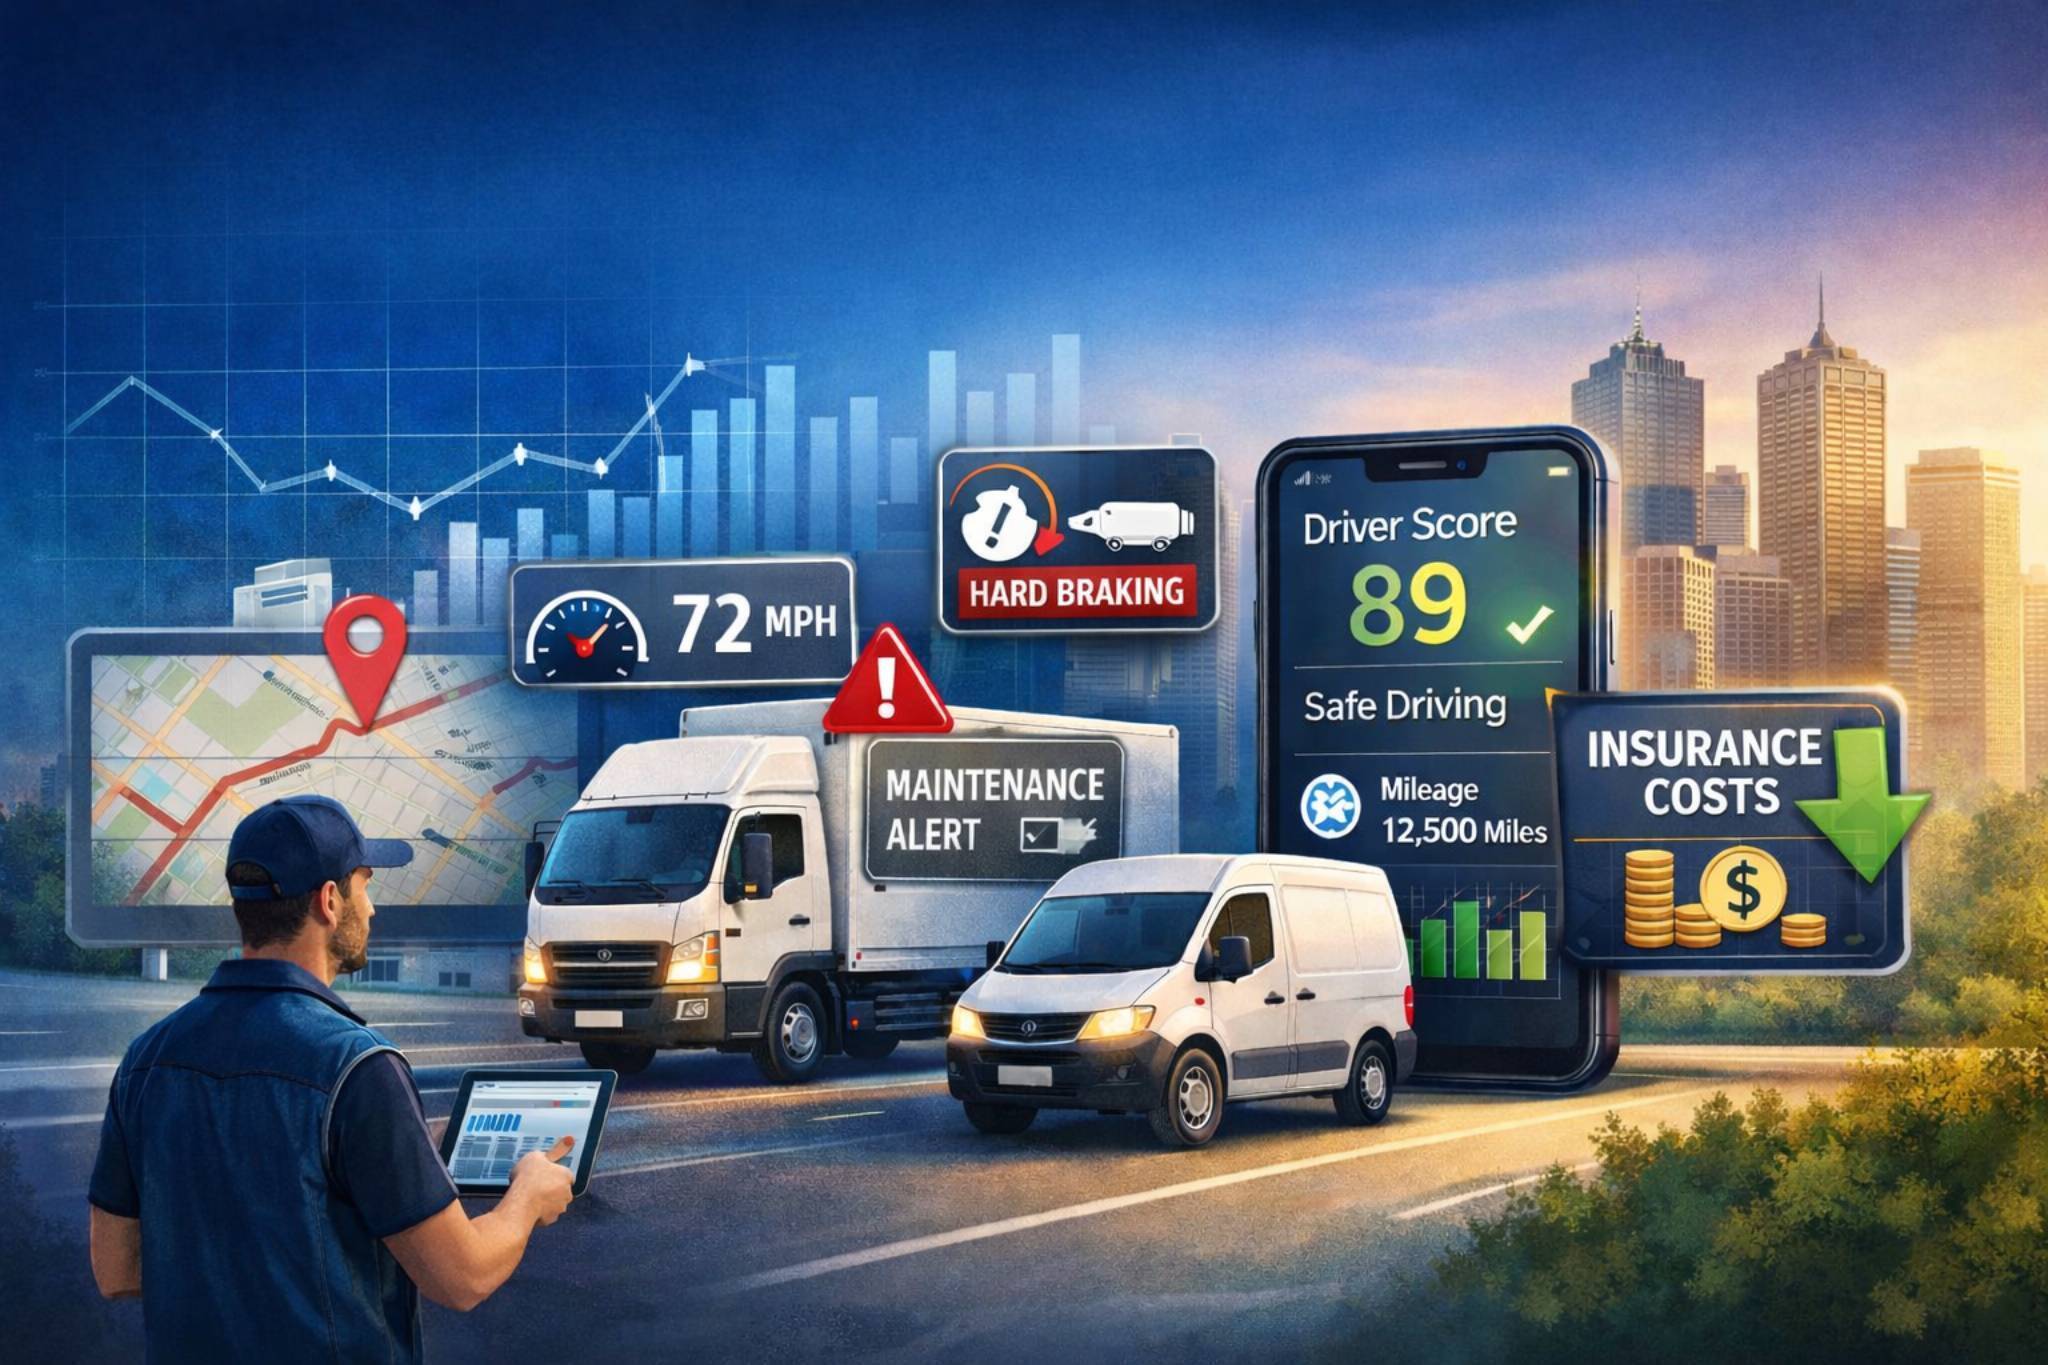
Even the best SOPs fail if they rely solely on manual enforcement. Technology removes variation by automating schedules, centralizing records, and providing real-time visibility. Instead of hoping every location follows instructions, software ensures they do.
Fleet management platforms allow organizations to assign identical maintenance schedules, inspection checklists, and reporting standards to every vehicle. This eliminates guesswork and ensures compliance without constant oversight. Tools that centralize service history and documentation also make audits and performance reviews far more efficient.
Centralized fleet management platforms apply universal PM schedules, digital inspection checklists, and reporting standards to every vehicle from one configuration point. When a manager updates a maintenance interval or inspection requirement, the change propagates to all locations automatically. Work order tracking and centralized service histories ensure that every repair is logged against the correct vehicle regardless of which branch performed the work, so service records remain usable for warranty claims, compliance audits, and replacement decisions across the full fleet lifecycle. For fleet managers who want a framework covering how standardization connects to broader operational improvements, the guide to improving fleet management covers the full eight-strategy picture with technology at its core.
Getting Buy-In From Distributed Teams
Technology alone doesn’t create alignment, people do. Teams need to understand why standardization benefits them personally, not just the company.
Address the “But We’ve Always Done It This Way” Mindset
Resistance often comes from fear of losing autonomy or being blamed for past practices. Emphasize that standardization reduces stress, improves safety, and creates fair expectations rather than removing control.
Training and Onboarding Across Locations
Training should be continuous, not a one-time event. New SOPs must be reinforced through refresher sessions and practical demonstrations. Providing clear onboarding materials ensures new technicians and managers adopt standardized practices from day one.
Effective change management often includes:
- Demonstrating time savings through automation
- Showing cost reductions from preventive maintenance alignment
- Sharing success metrics from early-adopting locations
- Providing simple documentation rather than complex manuals
- Recognizing teams that successfully implement new standards
Measuring Success: KPIs for Standardized Operations
Standardization only works if results are measurable. Tracking the right KPIs reveals whether alignment is improving performance or simply adding process overhead.
Fleet managers typically monitor:
- Maintenance cost variance between locations
- Downtime consistency across vehicle groups
- Inspection completion rates
- Compliance audit scores
- Average repair turnaround time
- Cost per mile trends
How Multi-Branch Fleets Compare Operating Costs Across Locations
Multi-branch fleet cost comparison works when every location tracks costs using identical formulas and time periods. The tools that make this practical are fleet management platforms with location-filtered dashboards: each branch manager views their own vehicle costs, and leadership views all locations side by side in the same interface with the same calculations applied. Without a shared platform, cost figures from different locations are calculated differently (some include depreciation, others do not; some count labor separately, others bundle it into repair costs), making the comparison unreliable.
The three cost metrics that reveal the most about location-level performance are cost per mile by branch (shows operational efficiency relative to usage), maintenance cost as a percentage of vehicle value by branch (flags locations running aging vehicles past their replacement point), and reactive-to-planned maintenance ratio by branch (identifies which locations have the weakest preventive maintenance discipline). When these three are tracked consistently across branches, leadership can identify which location's practices to replicate and which need intervention. For a structured view of which metrics to track and how to build a cross-location reporting cadence, fleet data metrics and reporting benefits covers the full KPI framework.
When these metrics stabilize across branches, it indicates that SOPs and technology are working together effectively. Guides like Fleet Maintenance KPIs & Formulas help organizations define and calculate these measurements accurately.A unified fleet operation doesn’t happen overnight, but with structured SOPs, supportive technology, and engaged teams, consistency becomes achievable and scalable.
Frequently Asked Questions
-
What tools help fleets standardize PM schedules across regions?
Fleet management software standardizes PM schedules across regions by applying a single set of maintenance triggers (mileage thresholds, engine-hour counts, or calendar dates) to every vehicle in the fleet from one configuration point. When a vehicle at any location hits the defined threshold, the platform automatically generates a service reminder and work order without any manual input from local managers. The platforms that solve this problem most reliably are those with centralized schedule configuration, location-level visibility for branch managers, and cross-location PM compliance reporting for leadership. -
What tools help standardize repair approval workflows for large fleets?
Repair approval workflows for large fleets are standardized using fleet management work order software that defines approval thresholds by repair cost, vehicle type, or urgency level, and routes each work order to the correct approver automatically. The system enforces the same approval rules at every location: a $500 brake repair at the Dallas branch follows the same authorization path as an identical repair at the Chicago branch, without a branch manager having to know the policy from memory. The key capability to look for is configurable approval tiers tied to cost ranges, so safety-critical repairs are fast-tracked while non-urgent work follows budget review. -
What tools help multi-branch fleets compare operating costs across locations?
Multi-branch fleet cost comparison requires a centralized platform with location-filtered dashboards, so every branch tracks costs using identical formulas applied by the same system. Without a shared platform, cost figures from different locations are calculated differently (some include depreciation, others do not; some bundle labor into repair costs, others separate it), making comparisons unreliable. Fleet management platforms that generate cost-per-mile, maintenance-cost-per-vehicle, and reactive-versus-planned maintenance ratios automatically for each location give leadership a like-for-like view without any manual data reconciliation. -
What tools help manage fleet inspections in multi-location operations?
Fleet inspections in multi-location operations are managed using digital vehicle inspection platforms that deploy the same inspection checklist to every driver at every location, capture time-stamped photo evidence of defects, and surface failed inspection items as work orders in the maintenance system automatically. The standardization value of digital inspection tools is not the technology itself but the elimination of location-specific inspection habits: when every driver uses the same checklist with mandatory fields and photo requirements, the quality of inspection data becomes consistent regardless of which branch submitted it. Cross-location inspection completion rates are then trackable from a single dashboard, so leadership can identify which branches have the highest missed-inspection rates. -
How do you set up automated recurring parts orders for a multi-location fleet?
Automated recurring parts orders for a multi-location fleet are set up by connecting fleet management software to a preferred supplier arrangement, where common high-frequency parts (filters, belts, brake components) are set to auto-reorder when stock at any location falls below a defined minimum. The most effective setups link parts consumption data from work orders directly to the reorder trigger, so the system orders based on actual usage rather than a fixed calendar schedule. Centralizing parts ordering through a single supplier with agreed pricing across all locations also ensures consistent quality and eliminates the cost variance that comes from each branch sourcing independently from local vendors.