PM Intervals for Mixed Fleets: Hours vs Miles Guide
Preventive maintenance (PM) intervals in mixed fleets must reflect how assets actually wear, not just how they are categorized. Choosing between hours-based and miles-based triggers directly affects uptime, compliance reliability, and long-term operating cost control.

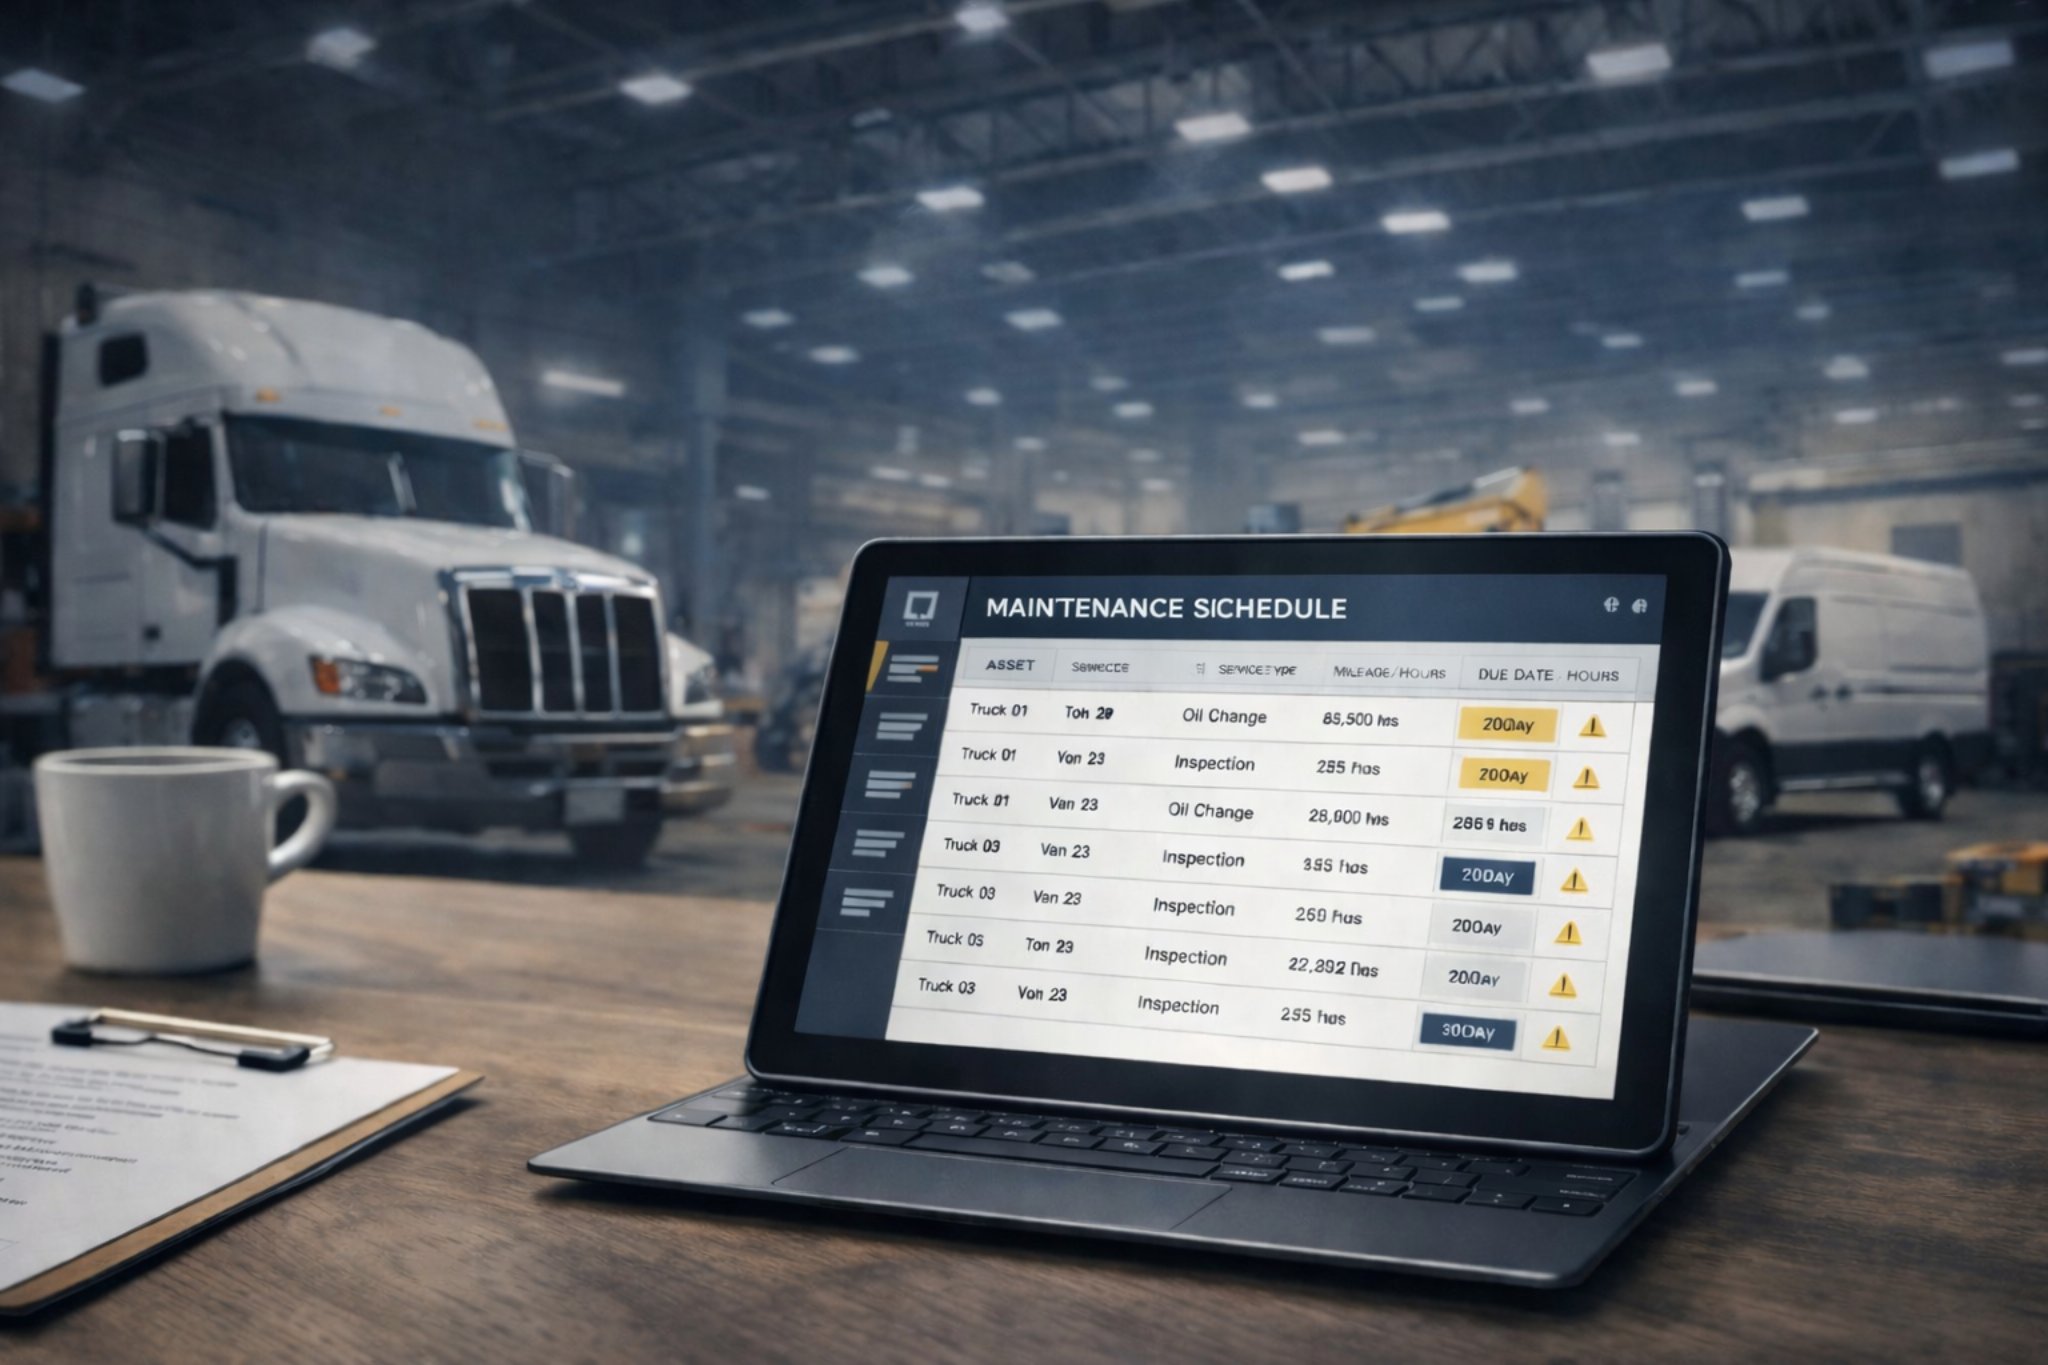
PM Trigger Type by Asset Category
| Asset Type | Primary Trigger | Secondary Trigger | Typical Range |
|---|---|---|---|
| Highway Trucks | Miles | Calendar | 8k–15k miles |
| Delivery Vans | Miles | Hours | 5k–10k miles |
| Construction Equipment | Hours | Calendar | 200–500 hours |
| Generators | Hours | Calendar | 150–300 hours |
| Utility Service Vehicles | Hours | Miles | 250–400 hours |
| Low-Use Specialty Units | Calendar | Hours | 6–12 months |
Miles-Based vs Hours-Based PM

Miles-Based PM
- Best for assets with predictable daily routes and steady odometer growth
- Reflects drivetrain wear and fluid degradation linked to distance
- Easier to forecast in logistics, delivery, and highway operations
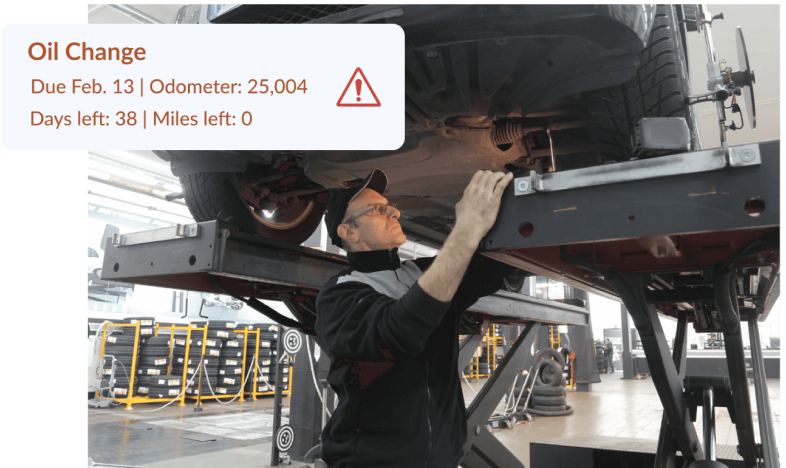
- Risk of under-servicing idle-heavy units with high engine time but low mileage

Hours-Based PM
- Best for equipment, idling vehicles, and power-take-off usage
- Captures engine load, idle wear, and non-driving utilization
- Essential for construction, utilities, and seasonal machinery
- Risk of over-servicing vehicles that accumulate mileage faster than engine hours
Why Mixed Fleets Require Dual PM Interval Logic
Mixed fleets combine assets that age differently even under similar operating environments. A single trigger method typically misrepresents true wear for at least one asset class. Dual-metric logic reduces blind spots and improves maintenance precision.
- Distance does not reflect idle wear, PTO usage, or stationary load
- Engine hours do not capture tire, suspension, and drivetrain distance stress
- Manufacturer guidance often specifies both distance and time thresholds
- Regulatory and warranty compliance frequently reference calendar intervals
- Dual logic prevents delayed oil changes on idle-heavy vehicles and premature service on highway units
Outcome cues
- More accurate service timing
- Reduced unplanned downtime
- Improved audit and warranty defensibility


Miles-Based Intervals — Best Fit Scenarios
Mileage is a strong indicator of wear when vehicles accumulate distance consistently and operate under similar duty cycles. It aligns well with tire wear, brake usage, and driveline stress.
- Line-haul and regional trucking with stable route distances
- Parcel and last-mile delivery fleets with daily route repetition
- Sales and service vehicles with predictable weekly mileage
- Assets with minimal idling or stationary equipment use
- Environments where telematics reliably capture odometer data
Outcome cues
- Clear forecasting of service windows
- Straightforward KPI tracking
- Easier parts and labor planning
Hours-Based Intervals — Best Fit Scenarios
Engine hours better represent mechanical stress when assets idle frequently or operate equipment without covering distance. This is common in off-road or auxiliary-powered use cases.
- Construction machinery, loaders, and excavators
- Utility trucks with PTO and extended idle periods
- Generators, compressors, and stationary power units
- Municipal or emergency vehicles with long idle durations
- Seasonal equipment with variable mileage but consistent engine runtime
Outcome cues
- Reduced risk of oil and filter overrun
- Better alignment with engine manufacturer guidance
- Improved reliability for load-bearing components


Building a Unified PM Framework for Mixed Fleets
A unified framework blends miles, hours, and calendar time into one maintainable schedule structure. The goal is not complexity, but accuracy and repeatability across asset categories.
- Define primary and secondary triggers per asset class
- Incorporate OEM factory schedules and warranty thresholds
- Add calendar caps to prevent extended deferrals on low-use units
- Standardize inspection checkpoints alongside service intervals
- Centralize service history and trigger logic in one system
Outcome cues
- Consistent maintenance governance across locations
- Clear escalation rules when multiple triggers are reached
- Better budgeting and parts forecasting accuracy
Final Takeaways
PM intervals in mixed fleets are most effective when they reflect real utilization patterns rather than a single universal metric.
- Use miles for distance-driven wear and highway assets.
- Use engine hours for idle-heavy or equipment-centric units.
- Apply calendar caps to prevent extended service gaps.
- Align schedules with OEM recommendations and compliance needs.
- Maintain centralized records to support audits and forecasting.
AUTOsist Fleet Management Resources

Preventative Maintenance Guide for Fleet Operations

How to Track Fleet Maintenance (Step-by-Step)
Preventive Maintenance Schedule Template
Fleet Preventive Maintenance Schedules