Miya Bholat
Jul 10, 2026
Data Government Fleets Need to Defend Their Budget
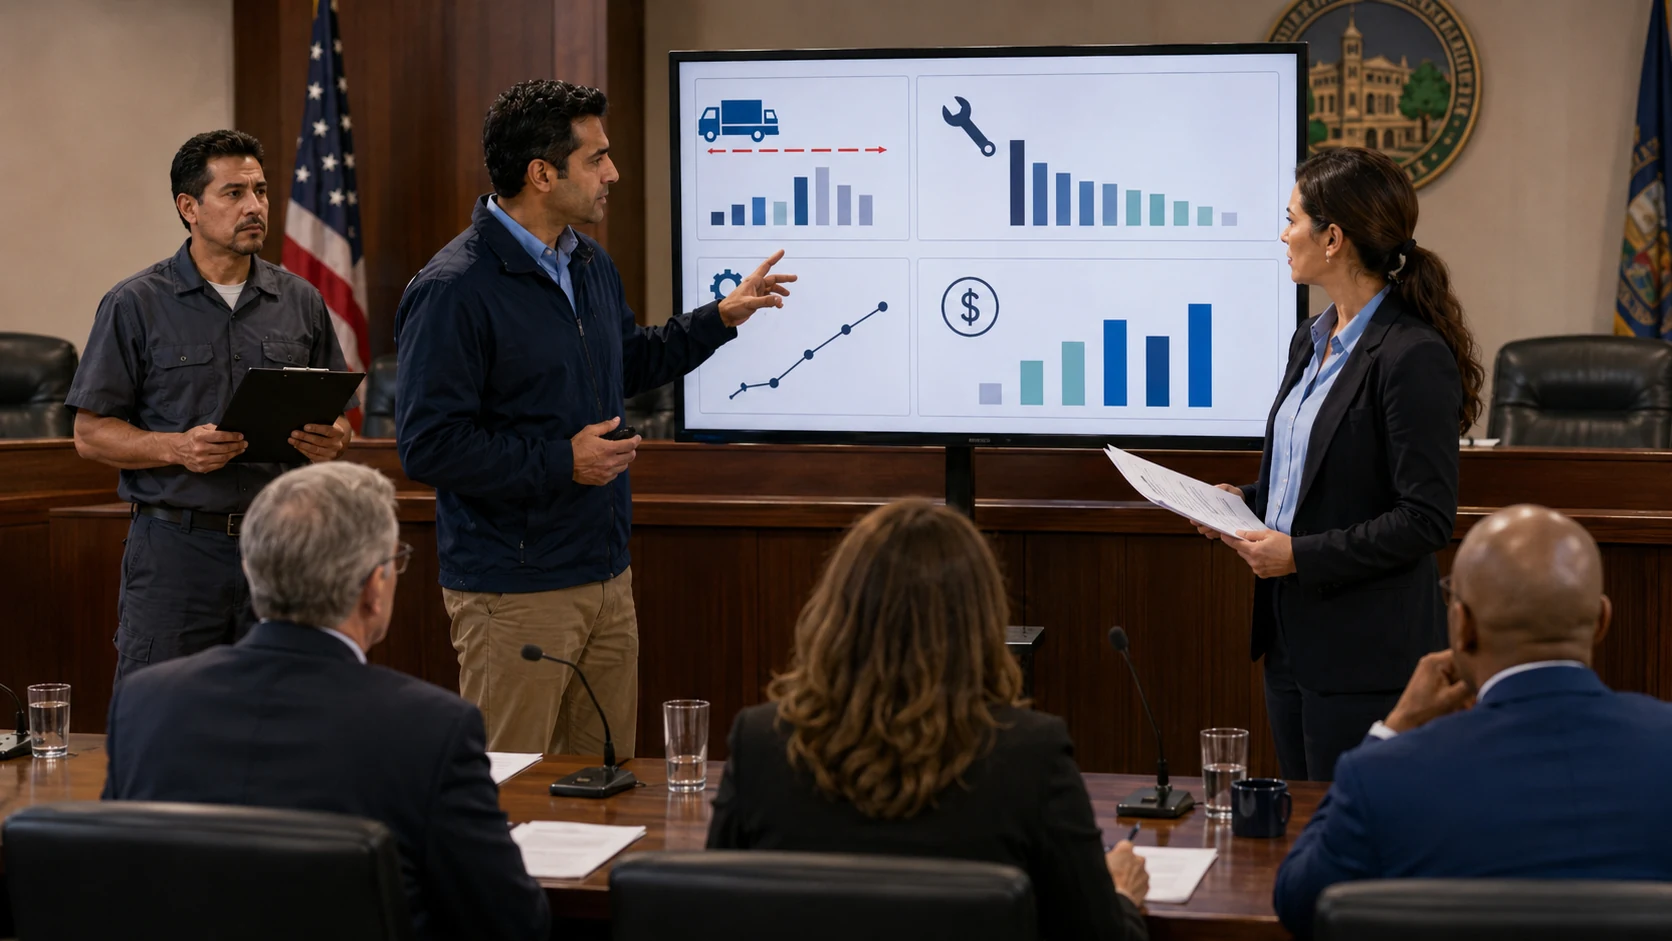
Government fleets defend their budget with proof that every vehicle, repair, replacement, fuel expense, and service disruption has a measurable operational reason behind it. The strongest budget requests connect total cost of ownership, cost per mile, utilization, preventive maintenance compliance, downtime, and audit ready reporting inside one reliable fleet management software system so finance teams, city councils, and department leaders can see the need clearly.
Key Takeaways
- Budget approval depends on defensible numbers. Government fleet managers need data that shows why spending is necessary, not just why it feels urgent.
- Cost per vehicle matters more than department totals. A fleet wide budget can hide expensive vehicles, rising repair trends, and underused assets.
- Replacement timing must be supported by lifecycle data. Maintenance history, cost per mile, downtime, and vehicle age help prove when replacement costs less than continued repair.
- Utilization data protects fleets from waste objections. Underused vehicles can be reassigned or removed, while overworked assets can justify added capacity.
- Maintenance and inspection records support audit readiness. Clean records help fleets respond to finance reviews, council questions, FOIA requests, and compliance checks.
- Digital reporting turns fleet activity into budget evidence. Reports on service history, fuel spend, work orders, inspections, and downtime make budget conversations easier to defend.
Why Budget Justification Is Harder for Government Fleets Than Private Ones
Government fleet managers do not answer to one CFO. They answer to city councils, finance departments, procurement boards, state auditors, taxpayers, and sometimes elected officials who are balancing visible public priorities. Every dollar can become public record, which means every replacement request needs documentation that can survive budget review.

A private fleet that needs 10 new vans may approve the purchase in weeks. A government fleet director requesting 10 police cruisers or public works trucks may need competitive bids, legislative approval, and funding authorization that can stretch 18 to 36 months. That delay explains why the average government vehicle is 7.4 years old, compared with 3.9 years in the private sector. The result is a fleet where replacement decisions become political, not just operational.
The scale of public fleet spending also raises scrutiny. The federal government operated more than 670,000 vehicles in 2023, drove more than 4.6 billion miles, and reported $5.5 billion in operating costs through GSA's Federal Fleet Report. That level of spending shows why fleet data must be complete, consistent, and ready for review.
The pressure is growing. Aging vehicles that are 10 years or older cost 35% more per mile to operate than newer assets, and 54.4% of fleets surveyed in a 2026 benchmark report listed rising costs as a top concern. For government fleet management, the budget challenge is not proving that work exists. It is proving that the spending request is the most responsible use of public money.
The Core Data Categories That Win Budget Approvals
A strong fleet budget request is not built around a story alone. It is built around a data package that connects spending, service risk, asset condition, and public accountability. Five categories matter most because they answer the questions finance teams and councils usually ask first.
Total Cost of Ownership (TCO) Per Vehicle
Total cost of ownership shows the real cost of keeping a vehicle in service. It includes purchase cost, fuel, maintenance, insurance, depreciation, administrative labor, and other ownership costs that do not always appear in one budget line.
Government fleets often keep vehicles long after their book value looks low. On paper, an older truck with no payment may look cost effective. In reality, the same vehicle may be producing higher repair bills, more downtime, and more staff time than a newer replacement would cost.
The average TCO for a government or municipal fleet asset in 2025 is $6,398, compared with the fleet wide average of $10,168. That lower number can be misleading. Lower spend may simply mean deferred replacement, limited usage, or repairs pushed into future budget cycles.
Fleet managers should calculate TCO like this:
| Data point | What to include | Why it matters in budget review |
|---|---|---|
| Acquisition cost | Purchase price, financing, upfitting | Shows capital investment |
| Operating cost | Fuel, insurance, registration | Shows recurring spend |
| Maintenance cost | PM, repairs, labor, parts | Shows condition and reliability |
| Downtime cost | Lost service days, rentals, overtime | Shows public service impact |
| Administrative cost | Staff time, paperwork, reporting | Shows hidden burden |
TCO data helps finance departments and elected officials understand when replacement timing is financially defensible. It also supports decisions about whether to keep, reassign, retire, or replace an asset.
Cost Per Mile (CPM) Across Asset Classes
Cost per mile turns fleet spending into an operational benchmark. The formula is simple: total fleet costs divided by miles driven. The value comes from segmentation. A single fleet wide average can hide the vehicle, department, or asset class that is driving budget pressure.
Government fleets averaged $0.27 per mile to operate in 2025, which is higher than the national fleet average despite lower miles driven. Vehicles older than 10 years can push that number even higher because their CPM is 35% above newer assets.
This is where budget conversations become easier. Instead of saying one truck feels expensive, the fleet manager can show that one aging utility truck costs far more per mile than similar vehicles in the same department. That is a stronger case than a repair invoice alone.
Scott County offers a useful example. Its motor pool vehicles cost $0.38 per mile compared with $0.55 per mile for personal vehicle reimbursement. After shifting to a vehicle first policy supported by data, annual reimbursement costs dropped from $250,000 to $41,706. That kind of comparison turns fleet data into a budget saving argument.
Vehicle Utilization Rates by Department
Utilization data answers one of the most sensitive public sector questions: are we paying for vehicles that sit unused? Underutilization can look like waste, but when tracked correctly, it becomes a tool for right sizing and budget reallocation.
Many public sector fleets carry 20 to 35% more vehicles than operational demand requires. Agencies that use right sizing strategies have reduced motor pools by 30% and saved $360,000. One agency saved $800,000 by identifying and eliminating underutilized vehicles through utilization analytics.
Useful utilization measures include:
- Miles driven per month by vehicle
- Hours used per week by department
- Days available compared with days used
- Seasonal demand by asset type
- Shared pool usage compared with assigned vehicles
A vehicle used 70% or less should trigger review for reassignment, sharing, or disposal. The same data can also support new vehicle requests when a department shows chronic overuse, delayed work, or too few available assets for public service needs.
Maintenance Cost History and PM Compliance Rates
Maintenance history is the clearest repair versus replace evidence. If a vehicle worth $20,000 creates $6,200 in annual maintenance cost, that equals 31% of its value. Once annual maintenance reaches 30 to 40% of current value, replacement becomes easier to justify.
Preventive maintenance compliance adds another layer. Every $1 spent on preventive maintenance can save $4 to $8 in emergency repairs, towing, and downtime. Structured PM programs can reduce unplanned breakdowns by 30 to 40% and extend vehicle life by 20%. Proper programs can also deliver 300 to 500% ROI through lower repair cost, reduced downtime, and longer vehicle lifespan.
A reliable vehicle service history helps fleet teams show whether repair spending is isolated or recurring. When paired with fleet preventive maintenance schedules, the data shows finance leaders that the fleet is not just asking for money, it is managing risk before it becomes more expensive.
Direct repair costs often represent only 60 to 70% of true maintenance expense. The remaining 30 to 40% comes from indirect costs such as downtime, staff coordination, overtime, rentals, and service disruption. That hidden cost is exactly what budget reviewers need to see.
Downtime and Service Disruption Metrics
For government fleets, downtime is not just a maintenance issue. It can become a public service issue. A downed snowplow during a storm, an unavailable patrol vehicle, or a broken utility truck during an outage creates risk beyond the repair bay.
Vehicle downtime costs an average of $760 per day per vehicle. That number gives decision makers a direct financial reason to approve maintenance, replacement, and modernization plans. Predictive maintenance can reduce maintenance costs by up to 25% and increase uptime by 10 to 20%.
Downtime reports should connect cost to service impact. For example, a public works fleet management team should not only report that a truck was out for six days. It should also show the service routes delayed, backup vehicles used, labor hours affected, and rental costs created.
How to Turn Fleet Data Into a Budget Ready Report
Fleet managers who present data win budget battles more often than those who rely on verbal explanations. Budget decisions require documentation, and capital requests require numbers that reviewers can compare, question, and approve.
The report should match the audience. Council members usually want risk reduction and per vehicle cost clarity. Finance teams usually want trend lines, replacement timing, and documentation that aligns with GASB reporting standards. Fleet teams may care about oil changes, inspection notes, and work orders, but budget reviewers care about outcomes.
A strong budget ready report should include:
- Cost per vehicle and cost per mile by department
- Maintenance spend by asset age and class
- PM compliance and missed service trends
- Downtime days and service impact hours
- Replacement candidates ranked by lifecycle cost
- Inspection and repair documentation for audit review
Digital records matter here. Around 73% of paper DVIRs never reach the office, while enforced digital DVIRs can achieve 100% completion rates. A digital vehicle inspection app closes that reporting gap and helps fleet leaders show that inspection issues were captured, assigned, and resolved.
Reports should also be easy to export and explain. A fleet reports dashboard can help turn daily maintenance, fuel, inspection, and cost activity into a format that finance teams can review without asking the fleet manager to rebuild every number manually.
The Replacement Threshold Calculation: Making the Case to Replace, Not Repair
Government fleets often delay replacement beyond the point of financial logic because the approval process is slow. Competitive bids, council approval, and budget authorization can push replacement timelines up to 3 years. Federal truck fleets averaging more than 17 years show how limited replacement cycles force longer asset life, higher reactive maintenance, and more downtime.
The replacement threshold calculation gives fleet managers a clear way to remove emotion from the discussion. It compares annual maintenance spend with the current value and annualized replacement cost.
| Vehicle | Current value | Annual maintenance | Maintenance as value | Budget signal |
|---|---|---|---|---|
| Vehicle 7 | $20,000 | $6,200 | 31% | Replacement review needed |
| Vehicle 12 | $32,000 | $4,100 | 13% | Continue monitoring |
| Vehicle 18 | $18,000 | $7,800 | 43% | Replacement strongly justified |
A council member may not respond to "this vehicle keeps breaking." They will respond to "Vehicle 7 cost $6,200 this year, which equals 31% of its $20,000 value, and replacement is justified on a cost per mile basis."
Federal agencies also collect and report inventory, cost, and utilization data annually through the Federal Automotive Statistical Tool (FAST). That standard reinforces the same principle for local fleets: lifecycle cost analysis creates a stronger replacement case than repair history alone.
Common Data Gaps That Undermine Government Fleet Budget Requests
Most budget requests fail because the documentation is incomplete, not because the fleet need is fake. If a finance director asks for proof and the fleet team can only provide department totals, paper logs, or scattered spreadsheets, the request becomes easier to delay.
The most damaging gaps are usually predictable:
- No cost breakdown by vehicle
- No PM compliance history
- Utilization data that is not segmented by department or asset class
- No connection between downtime and public service impact
- Maintenance records that are not audit ready
These gaps create objections the fleet manager cannot answer quickly. About 91% of municipal fleet managers still track compliance with spreadsheets, paper logs, and siloed tools that were not built for public accountability. That is why spreadsheets versus fleet management software becomes more than an efficiency question. It becomes a budget defense issue.
Siloed data across departments and locations also increases cost per mile and makes TCO harder to track. Missing or incomplete records create compliance risk and political liability, especially when FOIA requests require documentation on demand. Federal reporting references such as 41 CFR 102-34 Motor Vehicle Management regulations show why vehicle records, utilization, and cost data need to stay complete and retrievable.
Planning Ahead: Aligning Fleet Data to the Government Budget Cycle
Government fleet budgets do not move at the speed of breakdowns. They follow fiscal calendars, department reviews, order windows, and approval cycles. A replacement need discovered during budget season may already be too late.
Fleet managers are advised to work 5 to 10 years ahead when planning vehicle purchases, especially because delivery lead times and order bank windows can shift quickly. Every month of clean maintenance records, utilization data, and cost history becomes evidence for next year's request.
A practical budget defense workflow looks like this:
- Collect monthly data: Capture maintenance, mileage, fuel, inspections, downtime, and utilization.
- Segment the data: Review by vehicle, department, age group, and asset class.
- Flag risk: Identify high CPM, low utilization, missed PM, and rising repair costs.
- Rank replacements: Use lifecycle cost, service impact, and age to prioritize requests.
- Prepare budget evidence: Export reports before finance review begins.
- Review year round: Share fleet performance updates before budget season, not only during it.
Defensible replacement planning matters because fleet decisions are built over time. PM compliance also supports audit readiness and grant eligibility, especially when federal grant dollars tie funding to fleet condition and reporting. The federal fleet reporting requirements show why clean records can support both operational planning and compliance conversations.
How Fleet Management Software Closes the Data Gap for Government Fleets
Most government fleets do not lack effort. They lack one clean place where maintenance, inspections, work orders, fuel, usage, and cost data can be turned into reports that budget reviewers trust.
A platform such as AUTOsist helps centralize the records behind budget defense. Work orders show what was repaired and why. Inspection logs show defects were documented. Maintenance histories show recurring cost patterns. Fuel tracking shows operating spend by vehicle or department. Reporting tools turn that activity into budget evidence without forcing managers to rebuild spreadsheets before every review.
The financial value becomes easier to explain when data connects to outcomes. Fleets using telematics have reported 16% fuel savings, 17% accident reduction, and 16% maintenance cost reduction. For a 100 vehicle fleet, those savings can exceed $350,000 annually. Municipalities using fleet management software also report up to 30% less downtime and 25% lower maintenance costs.
For budget defense, the most useful software capabilities are the ones that map directly to council and finance questions. Fleet fuel management software supports operating cost analysis. A connected reporting process helps fleet leaders explain where money goes, why it is needed, and what public service risk is reduced by approving the request.
Government fleets defend budgets best when every major request connects to cost, use, reliability, compliance, and service impact. When those numbers stay organized throughout the year, the budget conversation shifts from opinion to evidence. For teams that still rely on disconnected tools, modernizing the reporting process can make the next council review easier to defend.
Frequently Asked Questions
-
What data do government fleet managers need to justify their budget?
Government fleet managers need data that proves where money is going and why the spending is necessary. The most useful data includes total cost of ownership, cost per mile, vehicle utilization, maintenance history, preventive maintenance compliance, downtime, fuel spend, and replacement timing. Together, these numbers help fleet leaders explain budget requests to finance teams, city councils, auditors, and elected officials. -
How do you calculate cost per mile for a government fleet?
Cost per mile is calculated by dividing total fleet operating costs by total miles driven. For example, if a department spends $135,000 to operate a group of vehicles over 500,000 miles, the cost per mile is $0.27. Government fleets should calculate this by vehicle, department, asset class, and vehicle age because fleet wide averages often hide the vehicles creating the highest costs. -
When does it make more financial sense to replace a government vehicle than repair it?
A government vehicle becomes a strong replacement candidate when annual maintenance costs reach 30 to 40% of the vehicle's current value, especially if downtime and cost per mile are also increasing. For example, if a vehicle worth $20,000 needs $6,200 in annual repairs, the repair cost equals 31% of its value. That gives fleet managers a clear, data backed reason to request replacement funding instead of continuing reactive repairs. -
Why do government fleets struggle more with budget approvals than private fleets?
Government fleets face longer approval cycles, competitive bidding rules, public accountability, audit requirements, and political oversight. A private company may approve replacement vehicles quickly, but a municipal fleet may need 18 to 36 months for council approval, procurement, and budget authorization. That makes early planning and clean fleet data essential. -
How does fleet management software help government fleets defend their spending?
Fleet management software helps government fleets organize maintenance records, inspections, fuel spend, work orders, utilization, and cost history in one place. This makes it easier to produce reports that show why a vehicle needs repair, replacement, reassignment, or continued funding. Strong software reporting also helps fleet managers answer finance, audit, and council questions with evidence instead of manual spreadsheets.