Miya Bholat
Oct 12, 2026
Fleet Tire Cost Per Mile: How to Calculate It?

Fleet tire cost per mile measures how much each tire costs for every mile it delivers. Calculate it by adding the tire's purchase, installation, maintenance, and replacement costs, subtracting any recovered casing value, and dividing by its total service miles. It is one component of fleet cost management, but tracking it separately helps managers identify premature wear, compare tire choices, and reduce replacement expenses without compromising safety.
This matters for more than long haul trucks. In service fleet management, vans and pickups face frequent stops, tight turns, and varying loads that affect tire life differently from highway driving. The right calculation accounts for how each vehicle actually operates.
Key Takeaways
- Calculate the full cost: Include purchase, installation, maintenance, retreading, and disposal expenses, minus recovered casing value.
- Track individual tires: Record installation mileage, removal mileage, and wheel position to understand actual tire life.
- Use the latest benchmark carefully: ATRI's 2026 report puts average heavy truck tire costs at approximately 5 cents per mile using 2025 data.
- Investigate early wear: Inflation, alignment, loading, and tire specifications can affect replacement frequency.
- Evaluate retreading where appropriate: A reusable casing may deliver additional miles at a lower combined cost.
- Compare similar vehicles: A delivery van and a highway tractor need separate performance baselines.
What Tire Cost Per Mile Actually Measures (And Why the Simple Version Misleads)
Tire cost per mile, or tire CPM, measures the expense of keeping a tire in service relative to the distance it travels.
A basic fleet calculation divides annual tire spending by annual fleet mileage. While useful for budgeting, that number cannot explain which tires, vehicles, or operating conditions cause higher expenses.
For example, two pickups may have identical tire purchases but different replacement intervals. One travels mostly on highways while the other operates on rough construction sites. Their actual tire CPM can differ considerably.
This is why analyzing fleet operating expenses requires separating tire costs from other maintenance spending.
For actionable comparisons, track each tire through its service life, including position changes and any retreading. Aggregate those records by vehicle class, application, or axle position rather than treating every mile as equivalent.
The Real Formula: Every Cost That Belongs in Tire Cost Per Mile
The most useful tire CPM calculation includes every direct expense associated with a tire throughout its service life.
Tire CPM = (Purchase Cost + Installation + Maintenance + Retreading + Disposal Costs − Recovered Value) ÷ Total Tire Service Miles
For a casing that receives multiple treads, total service miles means the sum of mileage delivered during each usable service cycle. Do not count the same miles twice.
The Cost Inputs Most Fleets Leave Out
The original purchase invoice rarely represents the complete tire cost. Include the following expenses wherever applicable:
- Purchase price: The original tire cost, including the value of tires supplied with a new vehicle when measurable.
- Federal Excise Tax: Applicable to certain heavy truck tires, depending on their taxable characteristics.
- Mounting and balancing: Labor, valves, and installation materials.
- Maintenance: Tire repairs, rotation labor, and directly attributable tire servicing.
- Retreading: Inspection, preparation, and additional tread application.
- Disposal: Fees for tires that cannot return to service.
- Recovered value: Subtract any amount received from selling or recovering the casing.
A common accounting mistake occurs when fleets purchase vehicles with tires already installed. If those tires remain buried in the vehicle purchase price, the tire cost analysis misses their original value.
Reviewing fleet vendor charges can also reveal separate mounting, disposal, or service fees missing from tire expense records.
Capturing Accurate Mileage Per Tire
The biggest challenge is often mileage accuracy rather than the formula itself.
A vehicle odometer identifies total vehicle usage, but a tire may move between wheel positions or vehicles. Simply using the vehicle's current mileage produces inaccurate results unless you know when that tire entered and exited each position.
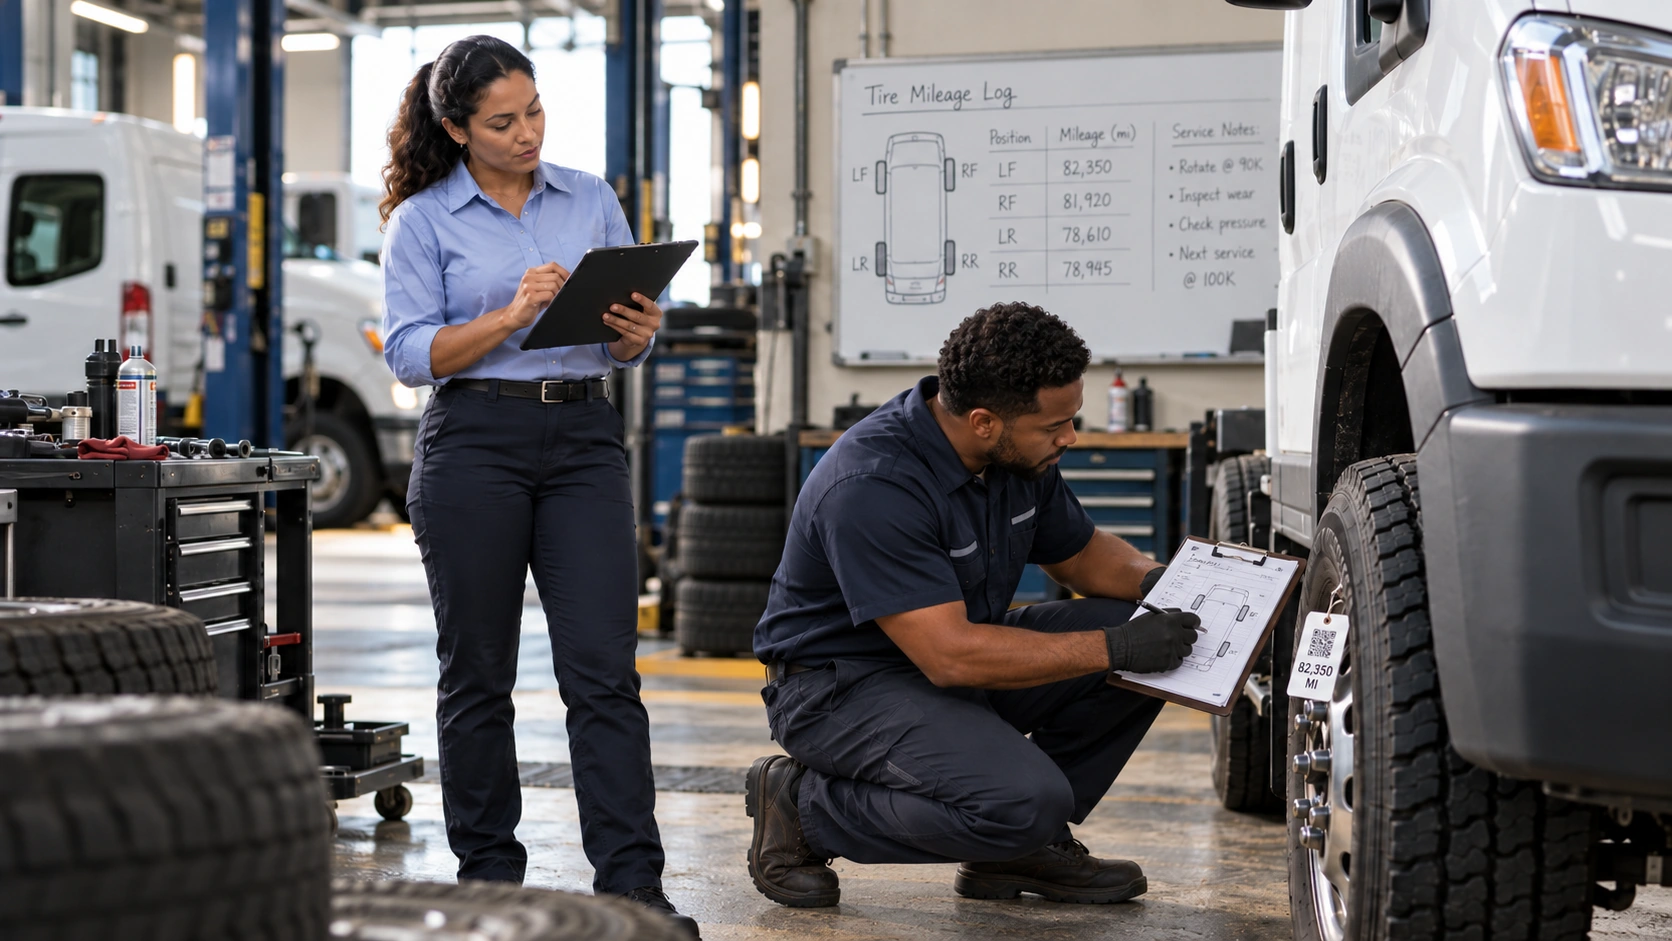
A reliable vehicle service history helps connect tire installation, servicing, and removal events to the corresponding odometer readings.
For every tire, maintain its identification number, vehicle, wheel position, installation date, installation mileage, removal date, removal mileage, and removal reason.
How to Calculate Tire Cost Per Mile
Follow this workflow for each tire or casing.
Consistent trip and mileage tracking supports accurate service records, although individual tire movements must still be documented.
A Worked Example: New Tire vs. Retread Across Full Casing Life
Consider a commercial truck tire that receives two retreads before its casing reaches the end of its usable life.
The following numbers are illustrative examples only, not quoted market prices or expected tire lifespans.
| Service Stage | Cost | Miles Delivered |
|---|---|---|
| New tire and initial installation | $500 | 100,000 |
| First retread and installation | $200 | 80,000 |
| Second retread and installation | $200 | 70,000 |
| Repairs and final disposal | $50 | 0 |
| Total | $950 | 250,000 |
The blended casing cost per mile is:
$950 ÷ 250,000 = $0.0038 per mile, or 0.38 cents per mile.
For comparison, the original tire alone cost $500 across its first 100,000 miles, equivalent to 0.50 cents per mile.
The additional service cycles reduce the blended tire CPM in this example, assuming the casing remains safe and suitable for retreading.
In commercial tire industry practice, retreads are commonly estimated at approximately 30% to 50% of a comparable new tire's price. Actual savings depend on casing condition, labor, inspection, and the mileage delivered afterward.
However, retreading does not automatically suit every fleet. Most light duty service vehicles replace complete tires instead. For those fleets, compare replacement brands and specifications based on actual miles delivered and total installed cost.
What Is a Good Tire Cost Per Mile in 2026?
The American Transportation Research Institute's 2026 Operational Costs of Trucking report, released July 15, 2026, reports an industry average tire expense of approximately 5 cents per mile in 2025, compared with 4.7 cents in 2024.
That represents a 6.4% increase. Tires accounted for roughly 2% of the reported $2.336 average total operating cost per mile for heavy trucks.
ATRI heavy truck tire cost benchmark
| Year | Cents |
|---|---|
| 2024 | 4.7 |
| 2025 | 5 |
This benchmark describes heavy trucking operations, not every commercial fleet.
Delivery vans, landscaping pickups, utility vehicles, and construction trucks have different tire sizes, loads, duty cycles, and replacement practices. Applying the same target across all of them can create misleading performance comparisons.
A better approach is to establish an internal baseline and track whether comparable vehicles are improving over time.
Changes in tire expenses also deserve attention alongside rising fleet maintenance costs, particularly when replacement frequency increases without a corresponding rise in mileage.
Why Your Tire Cost Per Mile Is Higher Than It Should Be
When tire CPM rises, investigate the cause before switching to a cheaper tire.
The most common problems fall into four categories.
Premature or Irregular Wear
Incorrect inflation, alignment problems, overloading, and improper rotation can shorten usable tire life.
Look for wear patterns that explain the problem:
| Wear Pattern | Possible Cause | What to Check |
|---|---|---|
| Both shoulders wearing | Underinflation | Cold inflation pressure |
| Center wearing faster | Overinflation | Pressure against load |
| One shoulder wearing | Alignment or suspension | Wheel alignment |
| Uneven patches or cupping | Suspension or balance | Shocks, balance, and wheel components |
These are diagnostic clues, not definitive diagnoses.
The U.S. Department of Energy also identifies proper tire inflation as important for tire life and fuel efficiency. Its fleet management recommendations emphasize maintaining the correct pressure.
Remember that tire removal decisions must prioritize safety. Under 49 CFR 393.75, applicable commercial vehicle front tires require at least 4/32 inch tread depth, while other covered positions generally require at least 2/32 inch. Damaged or unsafe tires may require removal earlier.
Casing Mismanagement
For fleets operating retreadable tires, scrapping a sound casing eliminates the possibility of additional service miles.
Track why each casing was rejected. Repeated sidewall damage, poor inflation practices, or preventable impacts may indicate problems beyond tire selection.
For smaller service fleets that do not retread, apply the same principle to premature tire disposal and repairability.
Wrong Tire Spec for the Vocation
A highway tire may not perform well on gravel, construction debris, or routes involving repeated sharp turns.
Choose specifications based on load, road surface, traction requirements, speed, and operating conditions rather than purchase price alone.
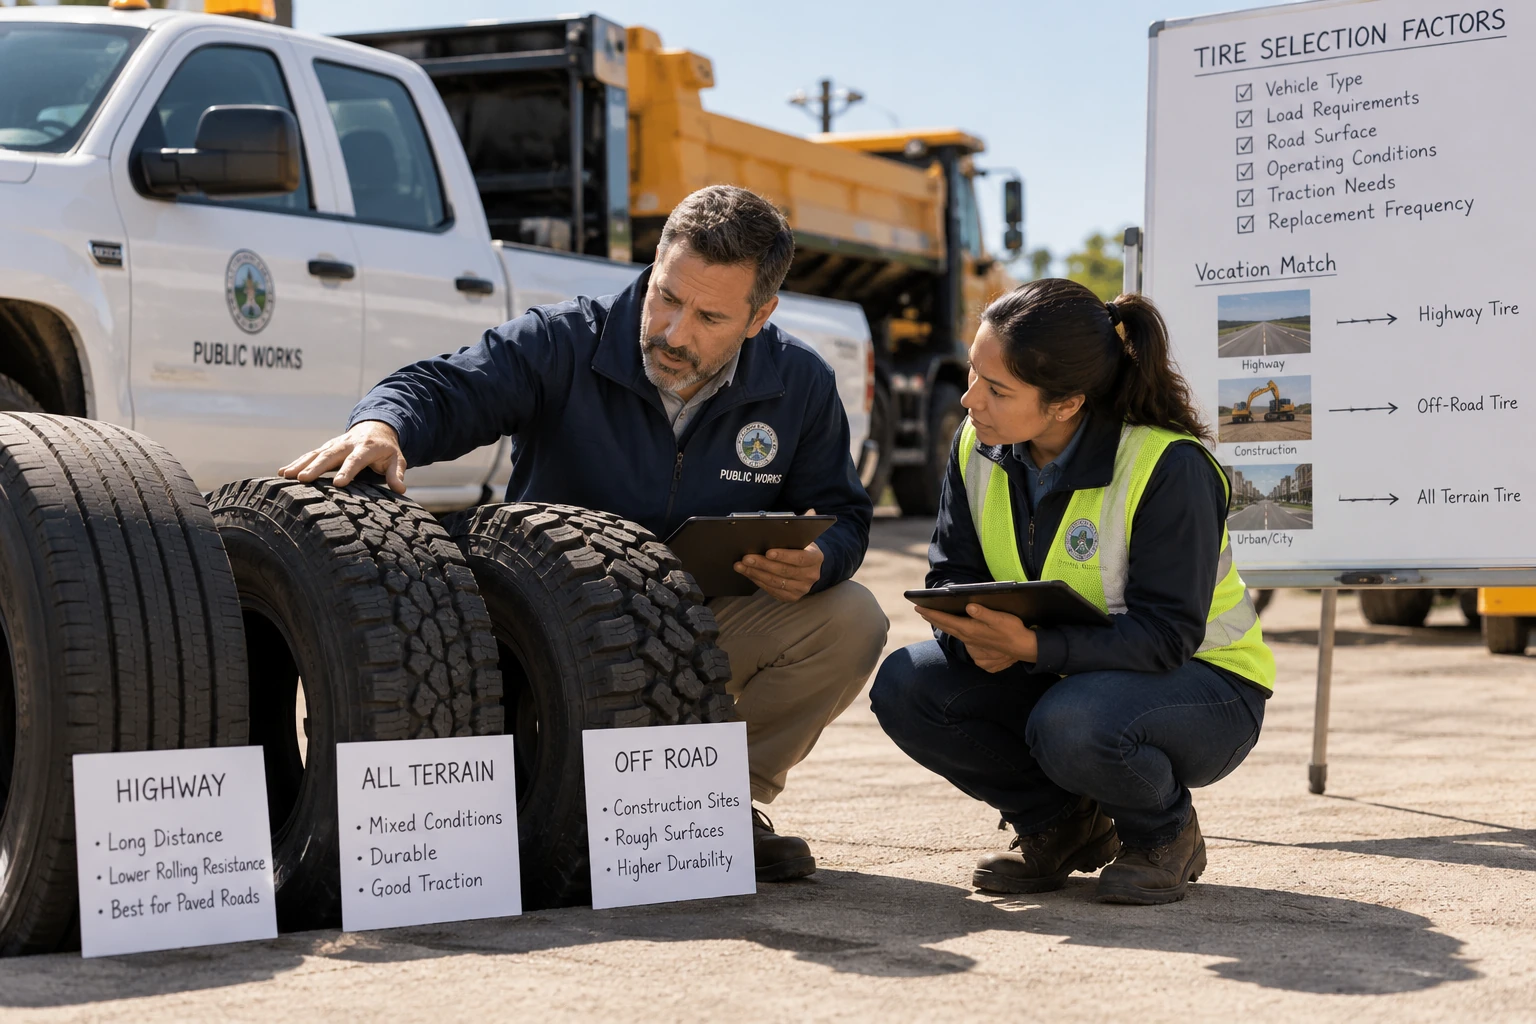
The Department of Energy also recognizes that tire design and rolling resistance affect vehicle efficiency, making tire selection a broader operating cost decision.
Missing or Scattered Data
A fleet might have purchase invoices, workshop notes, and inspection records stored separately. Without connecting them, managers cannot confidently identify cost drivers.
Missing removal mileage is especially damaging because it prevents an accurate calculation of the tire's actual service life.
Standardized records make it easier to distinguish poor tire performance from incomplete accounting.
How to Lower Tire Cost Per Mile Without Cutting Corners
Reducing tire CPM should mean improving usable tire life and controlling unnecessary expenses, not extending service beyond safe limits.
The following actions address the causes most fleets can influence.
- Make inflation checks routine. Measure cold tire pressures against manufacturer specifications and actual operating loads. Use consistent preventive maintenance schedules so checks happen before irregular wear becomes expensive.
- Manage rotation and tire positions. Record every movement and investigate unusual wear before moving a tire. Rotation should follow vehicle and tire manufacturer recommendations.
- Build a selective retread program. For suitable commercial tires, assess casing condition, repair history, and expected remaining service life before approving another tread.
- Match specifications to operations. Compare tires within similar vehicle classes and duty cycles. Consider traction, durability, load ratings, and replacement frequency rather than sticker price alone.
- Capture defects during inspections. Use digital vehicle inspections to document visible damage, tread condition, and inflation concerns before they cause roadside failures.
- Connect tire spending to maintenance activity. AUTOsist can help organize maintenance history, inspections, and work records so managers can review recurring tire expenses. Teams can use fleet maintenance work orders to record relevant service activity and costs, while maintaining tire identification and position records in their chosen tracking process.
- Review tire performance regularly. Compare tire CPM by vehicle type, axle position, and operating conditions. Investigate unusual increases rather than waiting until the next annual budget cycle.
A lower purchase price means little if a tire consistently requires earlier replacement or creates additional service expenses.
The goal is to deliver more safe, productive miles from every tire while keeping the underlying cost records accurate.
Conclusion
Tire cost per mile works best as a regularly updated measure of actual tire performance, not a calculation performed once a year. Track complete costs, individual tire mileage, and removal reasons to identify where spending increases and which improvements deliver lasting savings.
Frequently Asked Questions
-
How do you calculate tire cost per mile for a fleet?
Divide total tire lifecycle costs, minus recovered casing value, by total tire service miles. Include purchase, installation, repairs, retreading, and disposal expenses where applicable. -
What is a good tire cost per mile in 2026?
ATRI's 2026 report identifies approximately 5 cents per mile as the 2025 heavy truck average. Vans, pickups, and service fleets should establish separate benchmarks based on their operating conditions. -
How do you track mileage for individual fleet tires?
Record each tire's identification number, wheel position, installation mileage, and removal mileage. Update these records whenever a tire moves between positions or vehicles. -
Is retreading cheaper than buying new fleet tires?
Retreading can reduce cost per mile when a suitable casing delivers enough additional service miles. Compare total costs and usable mileage, not just purchase prices. -
Why do fleet tires wear out faster than expected?
Common causes include incorrect inflation, wheel misalignment, overloading, improper tire specifications, and demanding road conditions. Inspect wear patterns to identify the underlying problem.