Miya Bholat
Sep 30, 2026
How to Forecast Fleet Fuel Costs?
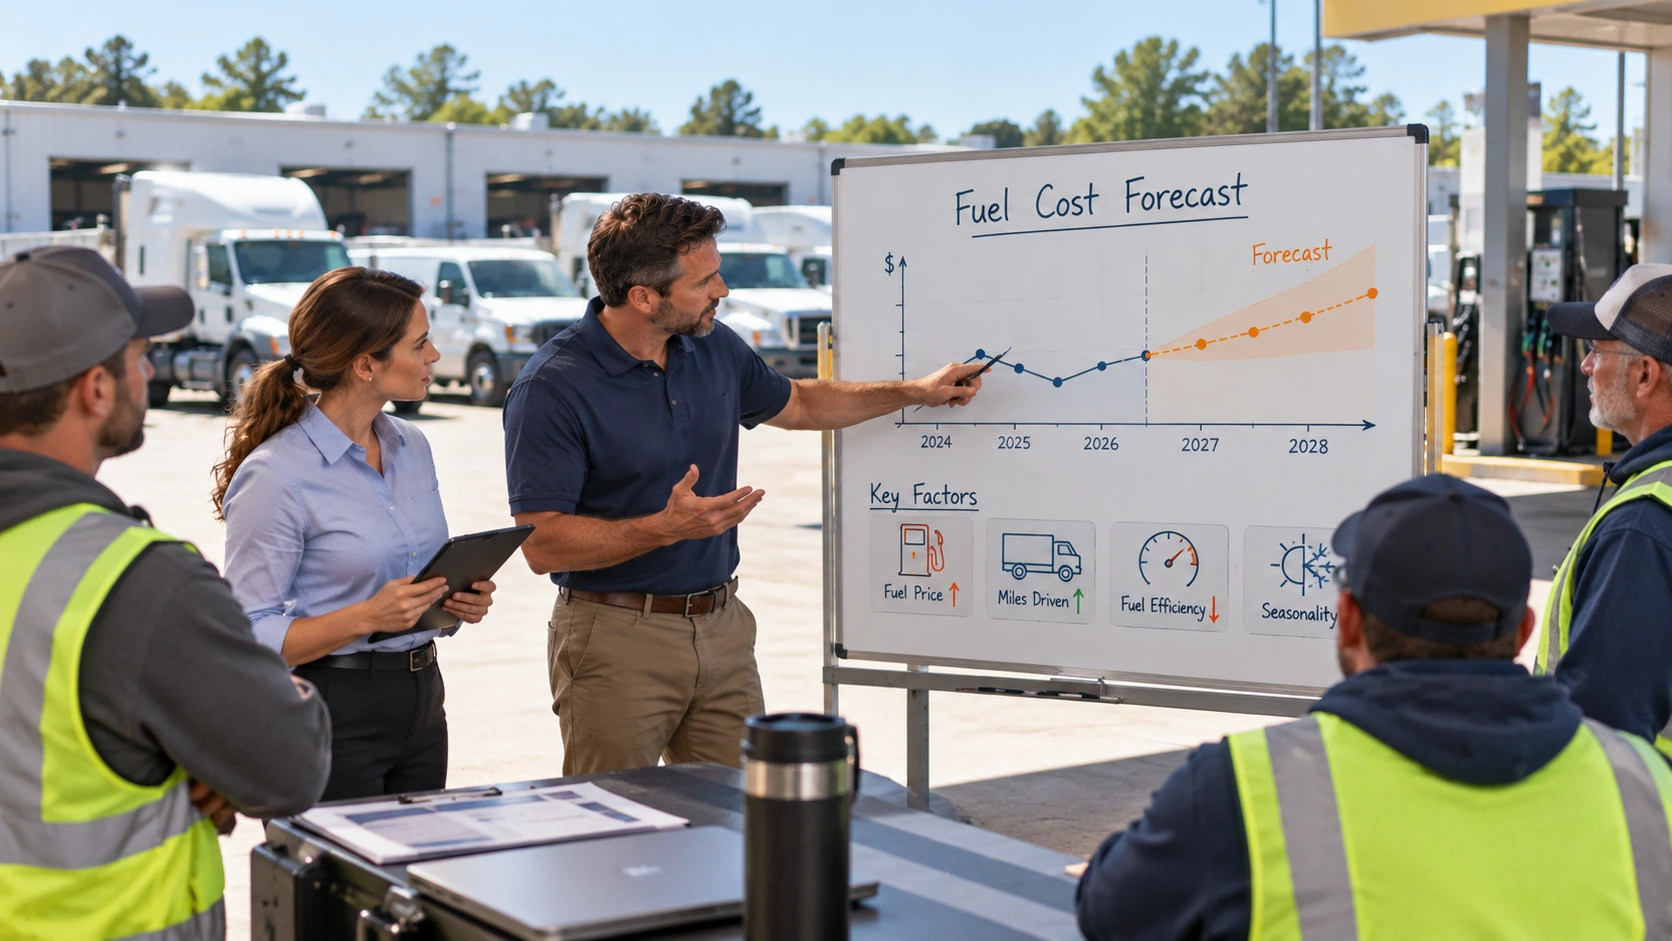
Forecast fleet fuel costs by estimating how many gallons each vehicle class will use, multiplying those gallons by a defensible fuel price, then updating the estimate as mileage, efficiency, and prices change. A useful forecast starts with clean vehicle level history from your fleet fuel management process, not one fleetwide average, because different classes consume fuel at very different rates.
For operations such as trucking and logistics fleets, the forecast becomes more useful when it reflects actual mileage, duty cycle, and fuel type instead of treating every truck as if it runs the same schedule.
Key Takeaways
- Forecast gallons before dollars. Estimate miles and MPG by vehicle class first, then apply the expected fuel price.
- Use vehicle or class level baselines. Fleet averages can hide high consumption vehicles and distort the forecast.
- Build more than one price case. Low, base, and high assumptions show the budget range if fuel prices move.
- Separate price, volume, and efficiency changes. That tells you why actual spend missed the forecast.
- Adjust for real operating changes. Seasonality, working days, additions, retirements, and mixed fuel types all shift expected consumption.
- Re forecast regularly. Monthly variance reviews and quarterly updates keep the number useful as conditions change.
What a Fleet Fuel Forecast Actually Predicts (and What It Cannot)
A fuel forecast is a forward projection of expected consumption and price. It estimates what the fleet is likely to spend if mileage, efficiency, and fuel prices behave within the assumptions you selected. It gives you a defensible range, not an exact invoice total.
The broader reasons fleet costs are difficult to forecast include changing utilization, maintenance, asset mix, and market conditions. Fuel forecasting narrows that problem to a repeatable calculation you can refresh as those inputs move.
The Core Fuel Forecast Formula
Use this formula for each vehicle class:
Projected miles divided by MPG, multiplied by price per gallon equals projected fuel spend.
Suppose 12 trucks are expected to travel 600,000 miles next year. If their expected average efficiency is 8 MPG, they need 75,000 gallons. At $5.07 per gallon, projected annual fuel spend is $380,250.
Do the same calculation for every meaningful class, then add the results. Avoid forcing unlike vehicles into one average because fuel use is hard to compare across vehicles when weight, route, engine, idle time, and duty cycle differ.
Build Your Consumption Baseline First
Start with about 12 months of fuel and mileage history whenever possible. Build the baseline by vehicle or by a genuinely comparable vehicle class. A single average can make a high consumption group disappear inside a larger pool of efficient units.
The ATRI Operational Costs research reported that the average cost to operate a truck in 2025 reached $2.336 per mile, while fuel represented about $0.482 per mile. That puts fuel at roughly 21 percent of the reported operating cost, showing why a modest error in fuel assumptions can matter to the budget.
The Data You Need to Forecast Well
Your baseline should contain enough information to separate fuel consumption from activity. At minimum, capture:
- Gallons purchased
- Miles driven
- Engine hours
- Fuel cost per mile
- MPG by vehicle and class
- Fuel type split
Consistent trip and mileage tracking gives the forecast a stronger activity denominator than estimates entered at year end.
Normalize by Miles or Engine Hours
Mileage is usually the cleanest denominator for road fleets. Engine hours work better for assets that spend substantial time working while stationary, such as construction equipment or certain public works units.
Normalization also keeps growth from looking like an efficiency problem. If fuel spend increased because the fleet drove 15 percent more miles, cost per mile can show whether fuel performance actually changed.

Set a Defensible Fuel Price Assumption
The price input should come from a repeatable source, not a guessed number with an arbitrary cushion.
The September 2026 U.S. Energy Information Administration Short Term Energy Outlook forecasts average U.S. retail gasoline at $3.84 per gallon in 2026, up from $3.10 in 2025, before easing to $3.35 in 2027. It also lists retail diesel at $5.07 in 2026 and $4.40 in 2027. Pull the current figure when you build the forecast because EIA updates the outlook monthly.
Where the Number Comes From
Build the price assumption from sources that reflect how your fleet actually buys fuel:
- EIA Short Term Energy Outlook as the primary national reference
- Fuel futures when you need a market based directional view
- Contracted pricing or fuel card pricing that reflects your purchasing structure
- Fuel surcharge recovery when part of the price exposure passes through to customers
Use national forecasts as a starting point, then compare them with what your fleet actually pays by region. Fuel trends can vary across fleet locations because local taxes, distribution costs, and market conditions differ.
Why One Number Is Never Enough
Even an authoritative forecast can move. In the September 2026 outlook, EIA raised its 2026 diesel forecast to $5.07 from $4.85 in the previous forecast. It also raised the 2027 estimate to $4.40 from $4.07. That is enough movement to shift a large fleet budget materially.
Treat your base case as the planning number, not the only possible outcome.
Model Scenarios, Not a Single Number
A practical forecast uses low, base, and high cases. You can vary price alone, or vary price, miles, and MPG together when operating demand is uncertain.
Using the same 12 truck class from the worked example:
| Scenario | Consumption Assumption | Price Per Gallon | Projected Annual Spend |
|---|---|---|---|
| Low | 570,000 miles, 8.2 MPG, 69,512 gallons | $4.40 | $305,854, $74,396 below base |
| Base | 600,000 miles, 8.0 MPG, 75,000 gallons | $5.07 | $380,250 |
| High | 630,000 miles, 7.8 MPG, 80,769 gallons | $5.60 | $452,308, $72,058 above base |
The table also shows sensitivity. Price, activity, and efficiency can all move spend, so test each input separately before deciding which assumption deserves the most attention.
Adjust for Seasonality, Duty Cycle, and Fleet Changes
Annual averages hide the calendar. A useful forecast maps expected activity to the months when the work actually happens.
Seasonal and Working Day Adjustments
Start with expected working days per month, then adjust mileage or engine hours for known seasonal patterns. Snow routes, summer delivery peaks, school schedules, construction seasons, cold starts, and air conditioning load can all change fuel consumption.
Historical reports can reveal repeated monthly patterns. A fleet reports dashboard helps when you want to compare fuel, mileage, and efficiency over the same periods.

New Vehicles, Retirements, and Mixed Fuel
Additions and retirements change the baseline during the year. If five vehicles enter service in July, do not give them 12 months of projected consumption. Apply their expected activity only to the months they will operate.
For mixed fleets, forecast diesel gallons, gasoline gallons, and EV kilowatt hours separately. Apply the appropriate price to each energy type, then combine the dollar totals.
Turn the Forecast Into a Monthly Variance Loop
The forecast becomes more valuable after the first month closes. Compare actual spend with forecast spend, then split the difference into causes instead of treating the whole variance as one number.
For example, if fuel spend finishes $18,000 above forecast, identify how much came from higher prices, extra miles, lower MPG, and excess idle. That tells you whether the next forecast needs a market assumption change or an operating assumption change.
Use this monthly workflow:
- Pull actual fuel gallons, cost, mileage, engine hours, and MPG.
- Compare actual fuel spend with the monthly forecast.
- Split the variance into price, volume, efficiency, and idle effects.
- Flag the vehicles, classes, locations, or routes driving the largest gap.
- Check whether the variance is temporary or likely to continue.
- Update the next quarter using the latest price and activity assumptions.
When the variance comes from operating behavior rather than market price, review fuel patterns that fleet managers can miss before changing the annual price assumption.
How Fleet Software Makes Fuel Forecasts Reliable
Reliable forecasting depends less on spreadsheet complexity and more on clean inputs. Vehicle level fuel records, mileage logs, reports, and telematics reduce the estimating required before you run the calculation.
In AUTOsist, fleet fuel management software can keep vehicle fuel records alongside mileage data, making it easier to refresh the model without rebuilding the baseline every month.
More current activity data can also come from GPS tracking and telematics, especially when mileage or operating patterns change before the next manual reporting cycle.
Fuel forecasting should remain separate from cost reduction. If your next question is how price changes affect profitability, energy prices and fleet operating margins addresses that decision rather than duplicating the forecasting method here.
Frequently Asked Questions
-
What fuel price should I use when forecasting fleet fuel costs?
Use the latest EIA fuel price outlook as a starting point, then compare it with your actual regional or contracted fuel prices. Build low, base, and high price cases instead of relying on one number. -
Should deadhead miles and idling be included in a fuel forecast?
Yes. Include deadhead miles in projected mileage and account for significant idling through historical MPG, gallons per engine hour, or a separate idle assumption. Leaving either out can understate expected fuel use. -
Should I forecast fuel using miles or engine hours?
Use miles for vehicles whose fuel use mainly follows distance traveled. Use engine hours for equipment and vehicles that spend significant time working or idling while stationary. -
How often should a fleet fuel forecast be updated?
Compare actual fuel use and cost against the forecast every month. Update the forward forecast quarterly, or sooner when fuel prices, mileage, efficiency, or fleet size changes significantly. -
Should I add a buffer to my fleet fuel budget?
A scenario range is better than adding an arbitrary percentage. Model a higher fuel price, more miles, or lower MPG in your high case so the extra budget has a clear operating assumption behind it.