Miya Bholat
Jul 14, 2026
Why Fuel Trends Vary Across Fleet Locations?

Fuel trends vary across fleet locations because each site operates under a different mix of fuel prices, taxes, climate, terrain, routes, driver habits, vehicle types, and maintenance conditions. The solution is to compare each location through a consistent fleet fuel management process that connects gallons, cost, mileage, vehicle class, season, and maintenance history instead of judging every site by one fleet average.
Key Takeaways
- Regional prices create an immediate cost gap. Taxes, refinery access, disruptions, and local competition can make identical fuel volumes cost very different amounts.
- Climate and terrain change consumption. Cold starts, cabin heating, air conditioning, hills, and congestion can reduce fuel economy.
- State taxes change location costs. Tax differences affect pump prices and reporting for fleets that cross jurisdictions.
- Driver behavior differs by site. Idling, speeding, acceleration, and route deviations often disappear inside fleet wide averages.
- Vehicle age and maintenance matter. Older vehicles and delayed service can make one site look less efficient than another.
- Centralized tracking makes comparisons fair. Cost per mile, fuel economy, idle time, vehicle class, and seasonal benchmarks separate normal conditions from waste.
Same Fleet, Different Fuel Numbers: What's Going On?
A fleet manager sees that Site A used 20 percent more fuel than Site B, even though both locations operate similar vehicles and cover similar mileage. The first assumption may be poor driving or inaccurate logs. The real answer may include colder mornings, steeper routes, traffic, taxes, older vehicles, or longer idle periods.

Fuel can represent more than 30 percent of operating expenses in high mileage transport operations, so location gaps deserve investigation. Effective fleet fuel cost control separates price variance from consumption variance. A site may pay more per gallon, burn more gallons per mile, or face both problems.
Use this first level diagnosis before blaming a driver or location:
| Question | What it reveals | Example metric |
|---|---|---|
| Is fuel more expensive locally? | Tax and supply cost variance | Average cost per gallon |
| Are vehicles using more fuel? | Efficiency or operating variance | Miles per gallon |
| Are routes more demanding? | Terrain, congestion, and stop frequency | Fuel cost per route mile |
| Are vehicles different? | Age, class, load, and engine variance | Miles per gallon by vehicle class |
| Is maintenance inconsistent? | Mechanical causes of higher consumption | Fuel change before and after service |
Regional Fuel Prices and Why They Swing So Much
Fuel prices include refining, distribution, taxes, environmental requirements, retailer costs, and local competition. EIA reported that 2025 average regular gasoline prices ranged from $2.677 per gallon on the Gulf Coast to $4.094 on the West Coast. That gap can make two efficient sites look financially unequal.
Managers should treat regional pricing as a baseline condition, then use fuel management best practices to identify the portion of the gap they can actually control.
State Fuel Taxes Create a Hidden Cost Gap
As of January 1, 2026, EIA data showed state gasoline taxes and fees ranging from 70.9 cents per gallon in California to about 9 cents in Alaska. State diesel taxes and fees ranged from 87.3 cents in California to about 9 cents in Alaska. Pennsylvania charged 74.1 cents per gallon on diesel, while Texas charged 20 cents. These figures exclude the federal gasoline tax of 18.4 cents and federal diesel tax of 24.4 cents.
For a multi state carrier, the issue extends beyond pump price. IFTA records must connect jurisdiction mileage with fuel purchases and taxes already paid.
Supply Chain Distance and Refinery Access
Locations farther from refineries, ports, pipelines, and blending terminals generally pay more because transportation and distribution costs rise with distance. EIA also notes that refinery shutdowns, pipeline disruptions, and maintenance can push regional prices higher when replacement supply cannot arrive quickly.
A delivery surcharge of 10 to 20 cents per gallon may appear in remote or constrained markets, depending on contracts, volume, distance, and storage access. California also requires a special gasoline blend and remains relatively isolated from Gulf Coast refining infrastructure, helping explain higher and more volatile West Coast prices.
How Climate and Terrain Quietly Drain Your Fuel Budget
A location can consume more fuel without an operational failure. Weather and roads change engine warm up time, accessory load, and resistance.
Cold Weather Fuel Penalty
The Department of Energy reports that conventional gasoline vehicles can lose 10 to 20 percent of fuel economy in city driving during cold weather. Short trips can produce losses from 15 to 33 percent, and one test found mileage about 24 percent lower on short trips at 20 degrees Fahrenheit than at 77 degrees.
Cold weather reduces efficiency in several ways:
- Engine oil and drivetrain fluids become thicker.
- Engines spend more time below efficient operating temperature.
- Tire pressure falls and rolling resistance rises.
- Denser air increases aerodynamic drag.
- Defrosters, heaters, lights, and heated equipment add load.
- Drivers may idle vehicles longer before leaving.
Northern locations should show a seasonal rise during Q4 and Q1. Concern begins when a site performs worse than its own winter baseline.
Heat, Elevation, and Stop and Go Routes
Extreme heat increases air conditioning demand and idling. Hilly routes require more engine output, while urban routes create repeated acceleration and braking.
NACFE found that shorter regional haul routes tend to report lower average miles per gallon because trucks spend more time on local roads and less time at steady interstate speeds. This matters when comparing trucking and logistics fleet operations across regions. A city site and a highway site may operate the same truck model but face completely different duty cycles.
Driver Behavior Isn't Uniform Across Locations
Driver behavior reflects local culture, supervision, scheduling pressure, traffic, and route design. One site may enforce shutdown rules while another allows idling during paperwork, loading, or breaks.
Common behavior signals include:
- High idle time per operating hour
- Rapid acceleration and harsh braking
- Speeding above efficient cruising ranges
- Unplanned detours or repeated route deviations
- Fuel purchases that do not match mileage
- Large differences between drivers using similar vehicles
Monthly totals hide these patterns. Pairing fuel records with GPS tracking and telematics helps managers compare mileage, idle time, speed, stops, and fuel use. Focus on behavior that remains inefficient after accounting for local conditions.
Fleet Age and Vehicle Mix Vary by Location
Many comparisons fail because vehicles are not equivalent. One branch may run newer vans while another relies on older trucks carrying heavier loads. Engine condition, tires, payload, and service history also differ.
Maintenance conditions that can increase fuel use include:
- Underinflated tires
- Dirty air or fuel filters
- Misaligned wheels
- Worn injectors or ignition components
- Incorrect fluids
- Unresolved engine fault codes
Consistent preventive maintenance schedules reduce this variation. Managers should also review each vehicle's service history before treating a fuel increase as a driver problem. A location with deferred maintenance may look operationally inefficient when the real cause is mechanical.
How to Normalize and Compare Fuel Data Across Locations
Fair comparison requires the same fields, date ranges, vehicle classes, and route categories at every site.
Track Fuel Cost Per Mile, Not Just Total Gallons
Total gallons ignore distance, load, vehicle class, and local price. Cost per mile and miles per gallon give a better comparison, especially with trip and mileage tracking.
Track these metrics by location:
- Total gallons and total fuel spend
- Average cost per gallon
- Miles per gallon by vehicle class
- Fuel cost per mile
- Idle hours and idle fuel
- Fuel use by route type and season
Centralize Fuel Logging Across Every Site
Paper logs and disconnected spreadsheets create delayed entries and missing mileage. A centralized fuel tracking system compares transactions, vehicles, drivers, mileage, and locations through one record structure.
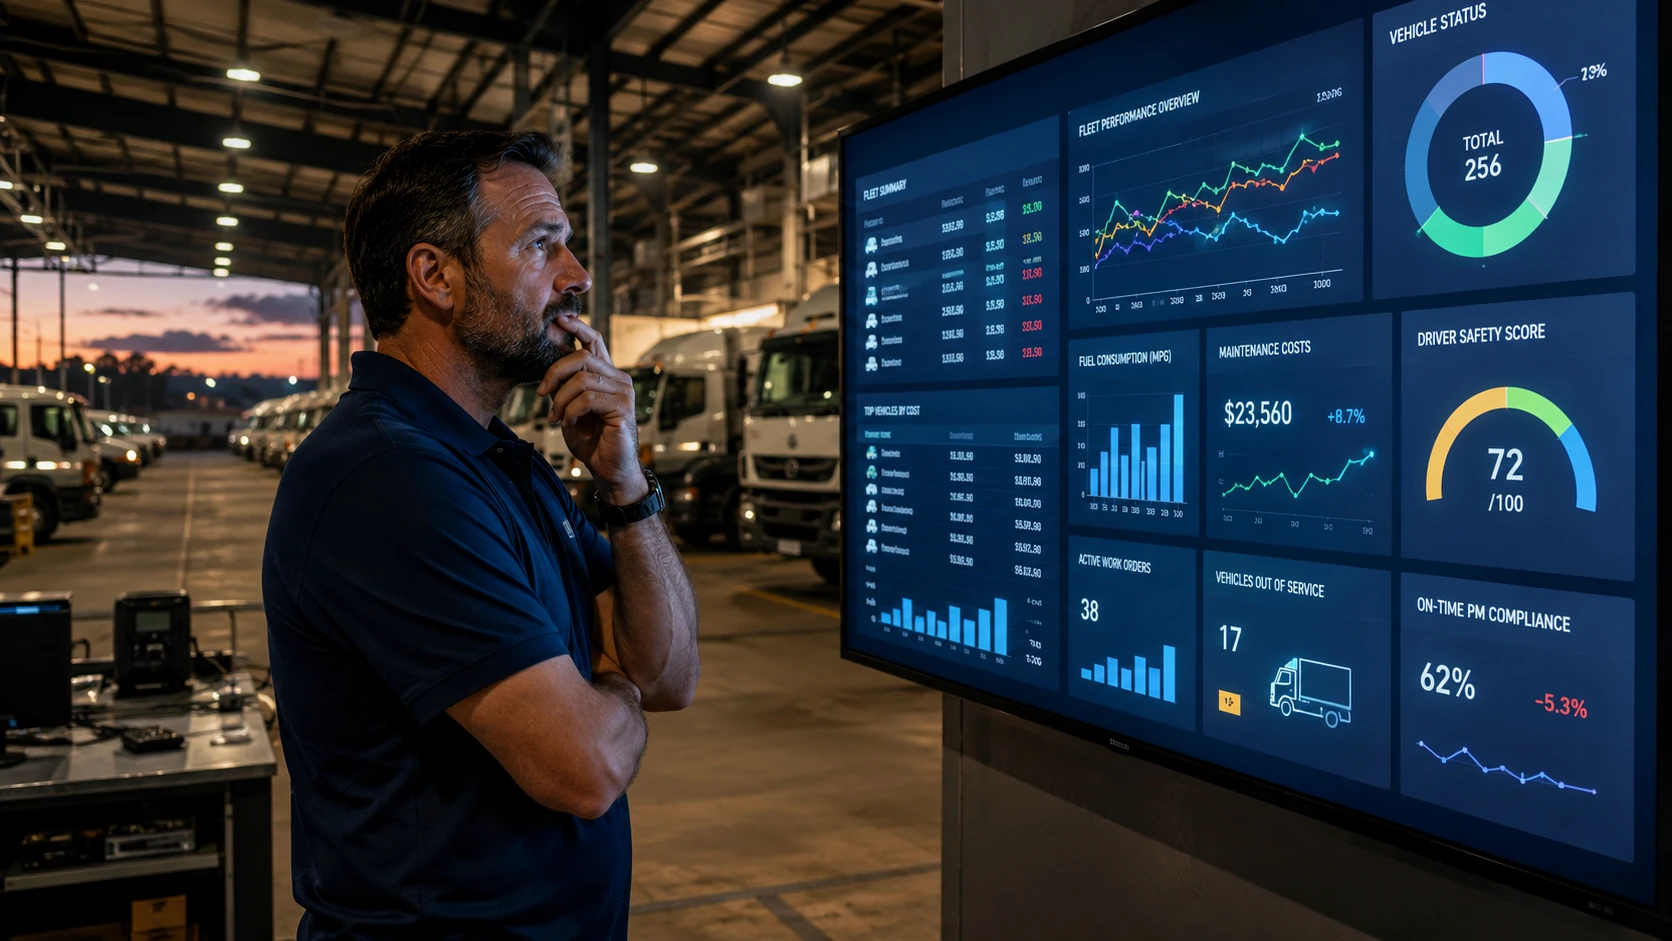
A fleet reporting dashboard should filter metrics by branch, vehicle type, driver, route, and period without removing local context.
Set Location Specific Benchmarks
A Minnesota winter site should not receive the same miles per gallon target as a Florida site operating in summer. Each location needs a benchmark based on its own normal conditions and comparable vehicle groups.

Use this review workflow:
Stop Guessing: Start Tracking Fuel by Location
Fuel differences are real, measurable, and manageable. Taxes explain part of the gap. Climate, terrain, traffic, drivers, vehicle mix, and maintenance explain the rest.
The practical fix is visibility. AUTOsist brings fuel records, maintenance scheduling, vehicle history, mileage, and reporting into one system so managers can create location aware benchmarks and act on meaningful exceptions. With accurate comparisons, fleets can reduce fuel costs across the fleet without setting unrealistic standards for individual sites.
Frequently Asked Questions
-
Why does my fleet use more fuel in winter?
Cold engines, thicker fluids, lower tire pressure, denser air, heating equipment, and longer idle periods reduce fuel economy. Compare winter performance with the same location's previous winter rather than with a warm weather branch. -
How do state fuel taxes affect fleet costs?
State taxes change the amount paid per gallon even when wholesale fuel costs are similar. Multi state fleets must also connect fuel purchases and jurisdiction mileage for IFTA reporting. -
What is the best metric for comparing fleet locations?
Fuel cost per mile is a strong financial metric, while miles per gallon measures vehicle efficiency. Use both and segment results by vehicle class, route type, season, and location. -
How can I tell whether a location has a driver behavior problem?
Compare idle time, speeding, acceleration, route deviations, and fuel use among drivers operating similar vehicles on similar routes. Investigate only after adjusting for traffic, terrain, weather, and load. -
Can deferred maintenance increase fuel use?
Yes. Low tire pressure, dirty filters, poor alignment, worn components, and unresolved engine problems can all increase consumption. Review service history whenever fuel economy changes without a clear route or price explanation.