Miya Bholat
Jul 13, 2026
Why Fleet KPIs Break Down as Fleets Grow?
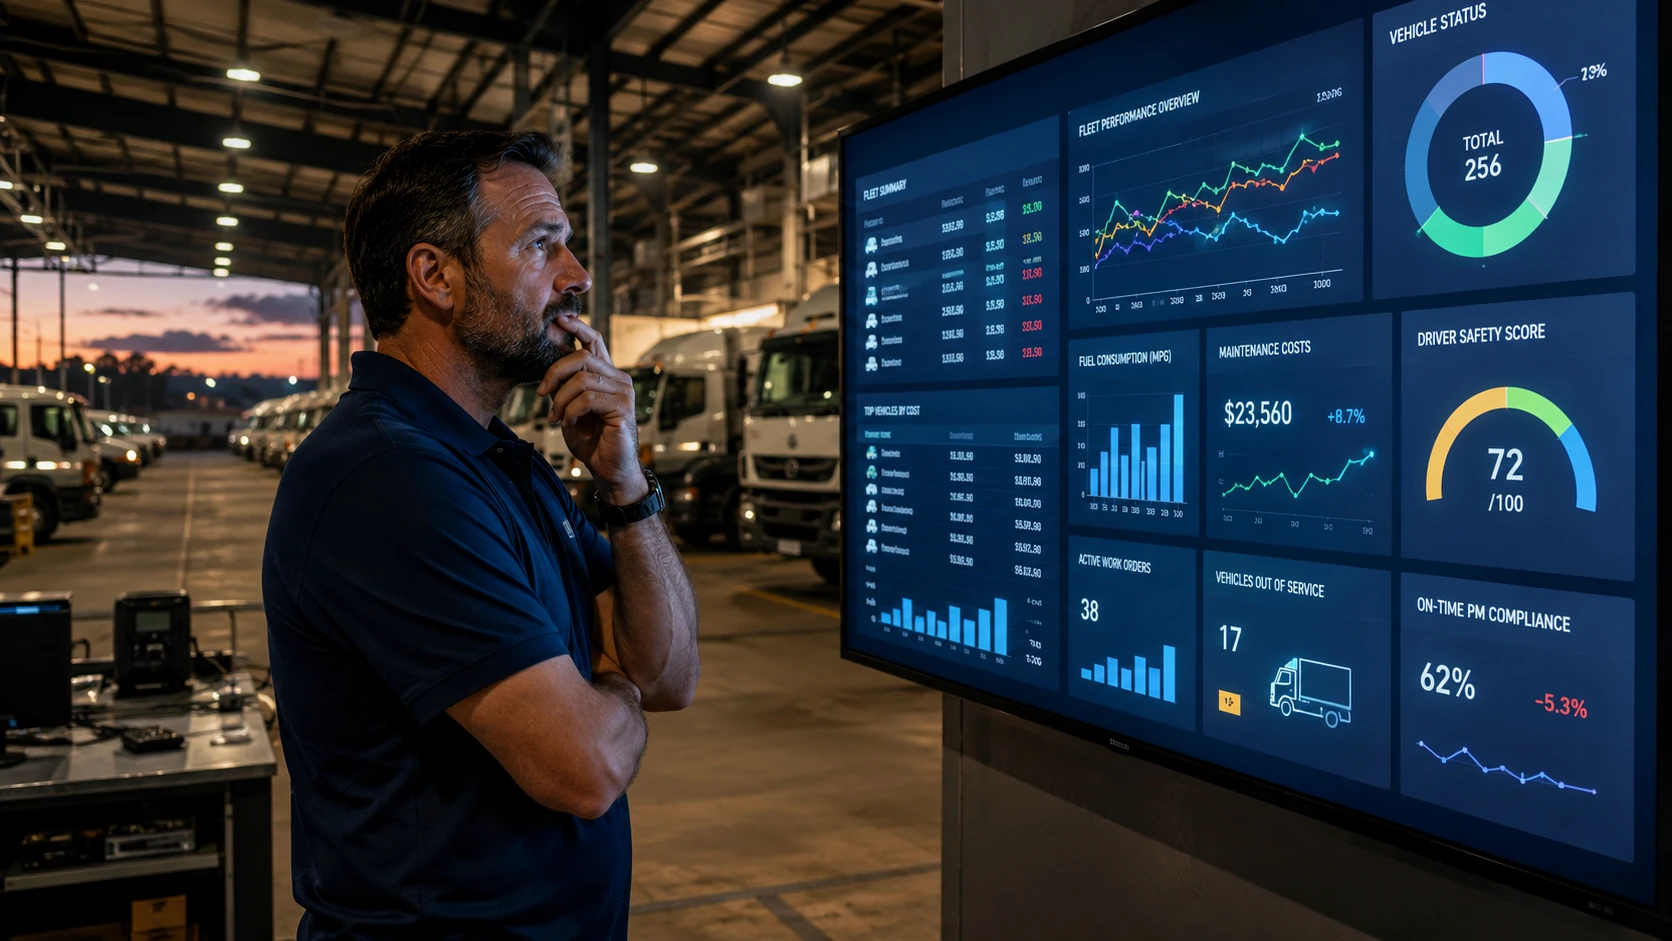
Most fleet managers assume that more vehicles means better data. In practice, the opposite happens. The KPIs that gave you a clear picture at 10 or 15 vehicles start misleading you at 40 or 50 not because you are tracking the wrong numbers, but because the entire structure behind those numbers stops scaling. Understanding this is the core of fleet performance management which is knowing not just which metrics to track, but when your measurement system itself becomes the problem.
Key Takeaways
- More data does not mean more clarity. Dashboard fatigue is real. Managers tracking 30 or more KPIs with equal visual weight stop using those dashboards within months. Fewer, better-organized metrics outperform bigger ones every time.
- Fleet averages hide your most expensive vehicles. In most fleets, 20 to 30 percent of vehicles account for 50 to 60 percent of total maintenance spend. A healthy fleet-wide average can mask this for months.
- Data capture gaps multiply with fleet size. At 15 vehicles, one missed work order is a small error. At 150, missed entries become systemic and every KPI downstream drifts from reality.
- Cost per mile means nothing without vehicle-level context. Blending CPM across vans, trucks, and EVs into a single number produces a figure that does not accurately describe any of them.
- KPIs are lagging indicators and the lag gets worse at scale. In a larger fleet, the gap between an event happening and appearing on a dashboard can stretch from hours to weeks.
- The fix is structural, not cosmetic. Adding new KPIs to a broken data collection process creates more noise. The real solution is automating data capture and segmenting metrics by vehicle class, location, and role.
The KPI Paradox: More Vehicles, Less Visibility
Here is the problem no one talks about openly: growing your fleet makes it harder to see what is happening inside it. You have more data coming in from more vehicles, more drivers, more routes and yet the reports feel less actionable than they did when you were running a smaller operation.
This is not a people problem. It is a structural one. Most fleet managers track between four and six core KPIs, but fewer than 30 percent have real-time data pipelines feeding those metrics. That means the numbers on a dashboard are often hours or days old by the time anyone reads them. At 10 vehicles, a two-day lag is manageable. At 60 vehicles, that same lag means you are making decisions on last week's reality.
Dashboard fatigue compounds this. Industry best practice in 2026 is to surface three or four "north star" KPIs at the top level with diagnostic metrics available via drill-down. But most fleets do the opposite: they add metrics as problems arise until a single screen is showing 30 to 40 data points with equal visual weight. Managers stop looking. Reports stop getting read.
How Fleet-Wide Averages Mask Your Most Expensive Vehicles
The 20/50 Rule: A Few Vehicles Drain Most of the Budget
In most mid-size to large fleets, roughly 20 to 30 percent of vehicles account for 50 to 60 percent of total maintenance spending. The numbers look fine in aggregate but underneath that healthy average is a small group of vehicles costing two or three times the median.

Consider a 40-vehicle fleet with an average maintenance cost of $6,200 per vehicle per year. That looks reasonable. But if eight of those vehicles are each averaging $14,000 or more annually due to age, misuse, or deferred repairs, those eight vehicles alone account for well over half the total maintenance budget. The remaining 32 vehicles are performing efficiently. The fleet-wide average hides all of this.
This is why vehicle service history at the individual asset level matters so much. Without it, those eight problem vehicles stay invisible inside the average for months and sometimes years before the cost pattern becomes undeniable.
Why Cost Per Mile Needs Vehicle-Level Context
Cost per mile is one of the most widely cited fleet KPIs. It is also one of the most misleading when applied to a mixed fleet without segmentation. The American Transportation Research Institute reported that average truck operating costs reached $2.26 per mile in 2024, up 38 percent since 2020. But that figure is for Class 8 long-haul operations. Applying it as a benchmark to a light-duty service van fleet is a category error.
A blended CPM that averages across light-duty vans, heavy-duty trucks, and electric vehicles tells you almost nothing useful about any of them. Each vehicle class carries different fuel consumption profiles, different maintenance intervals, and different depreciation curves. You need CPM calculated within vehicle classes, not across them.
Five Reasons Your KPIs Stop Working at Scale
The breakdown is not sudden. It is gradual, and it happens through five distinct mechanisms that each make the others worse.
Data capture gaps multiply. At 15 vehicles, a missed work order entry is a minor record-keeping error. At 150, missed entries are systemic. Radio calls, WhatsApp threads, and verbal shift handovers hold the real operational data and none of it reaches the system. Research suggests that 50 to 90 percent of what actually happens in field operations never gets logged anywhere. Every KPI built on that incomplete data is already compromised. Automating data entry through fleet maintenance work order software is one of the most direct ways to close that gap.
Spreadsheets become a bottleneck. Manual tracking works reasonably well at 10 vehicles. At 50 or more, it becomes a full-time data-entry job and by the time the report is compiled, it is already outdated. Inconsistent entry formats across team members mean the same data gets recorded differently by different people, making comparisons unreliable. The tasks that eat the most time in these situations are exactly the ones covered in this breakdown of time-wasting tasks fleet managers should automate.
Roles outgrow a single dashboard. A CFO needs cost-per-mile trends and budget variance. A dispatcher needs vehicle availability and route status. A maintenance technician needs upcoming PM due dates and open work orders. Forcing all three onto one flat dashboard is one of the most common UI failures in fleet software. When a screen tries to serve everyone, it ends up serving no one well.
Lagging indicators lag even further. By definition, KPIs report on events that have already happened. In a small fleet, the lag between an event and its appearance on a dashboard might be a few hours. In a large fleet with manual data entry and weekly reporting cycles, that lag can stretch to weeks. You are managing a situation that no longer exists.
Seasonal and operational noise increases. A larger fleet spans more routes, more climates, and more vehicle types. Without segmentation, a spike in fuel costs in one region during winter gets averaged into the overall fleet number and disappears. Seasonal pattern recognition becomes nearly impossible. This is a well-documented challenge covered in more depth in how seasonal demand impacts fleet performance.
Which Fleet KPIs Break First and What Replaces Them
The table below shows four KPIs that become unreliable at scale, why they break, and what a more useful version looks like.
| KPI That Breaks at Scale | Why It Breaks | Scaled Replacement |
|---|---|---|
| Fleet-wide fuel efficiency | Mixes vehicle classes, routes, and load types into one number | Fuel efficiency segmented by vehicle class and route type |
| Average maintenance cost per vehicle | Healthy outliers mask chronically expensive assets | Maintenance cost per vehicle ranked against class median |
| Overall PM compliance percentage | A fleet at 88% compliance can still have critical vehicles 60 days overdue | PM compliance broken down by vehicle, not fleet aggregate |
| Blended downtime percentage | One asset category dragging the average hides operational realities in others | Unplanned downtime tracked separately by vehicle class and location |
For fuel specifically, fleet fuel management software that captures consumption at the vehicle level rather than rolling it up into a single fleet figure is what makes the segmented replacement metric actually possible. Without vehicle-level fuel data, the better KPI has no foundation to stand on.
How to Build a KPI Framework That Grows With Your Fleet
Tier Your KPIs by Priority
The north star approach works like this: pick three or four primary KPIs that tell you whether the fleet is healthy at a glance. Cost per mile, vehicle utilization, unplanned downtime, and PM compliance are strong candidates for this top tier. Everything else like fuel variance by route, parts spend by category, repair time by shop lives one layer below, accessible on demand through drill-down.
This is not about tracking less. It is about organizing information so that the most important signals are never buried. A fleet reports dashboard built on a layered model means your team reads the dashboard instead of ignoring it. That single behavioral change has more impact on fleet outcomes than adding five more KPIs ever would. The principles behind building this kind of system are explored in depth on fleet data visualization and dashboards.
Segment Metrics by Vehicle Class, Location, and Role
Segmentation is the single most impactful structural change you can make to a scaling KPI system. Metrics should be compared within vehicle classes, not across them. A regional breakdown matters when your fleet operates across multiple climates or geographies. Role-based views different dashboards for operations, finance, and maintenance mean each person gets the signal relevant to their decisions.
For fleets running across multiple sites, the challenge of keeping metrics consistent and comparable across locations is real. Standardizing how data is captured and reported across branches is a core part of how to standardize fleet operations across locations. Without that consistency, segmented metrics become just as noisy as the blended averages you were trying to escape.
Automate Data Capture Before You Add More KPIs
Adding more KPIs to a broken data collection process does not improve visibility. It creates more noise. The root problem in almost every scaling fleet is that data entry is manual, inconsistent, and incomplete. The KPIs are only as accurate as the data behind them.
Automated data capture through digital inspections, connected work orders, and GPS-linked mileage tracking solves this at the source. AUTOsist captures maintenance data through digital vehicle inspection apps, fleet preventive maintenance schedules, and trip and mileage tracking without requiring manual input at every step. When the underlying data is clean and current, every KPI built on top of it becomes reliable.
When Spreadsheets Stop Working: Signs You Need Fleet Software
Most fleets start on spreadsheets. There is nothing wrong with that. The problem is recognizing when spreadsheets have become the constraint rather than the solution.
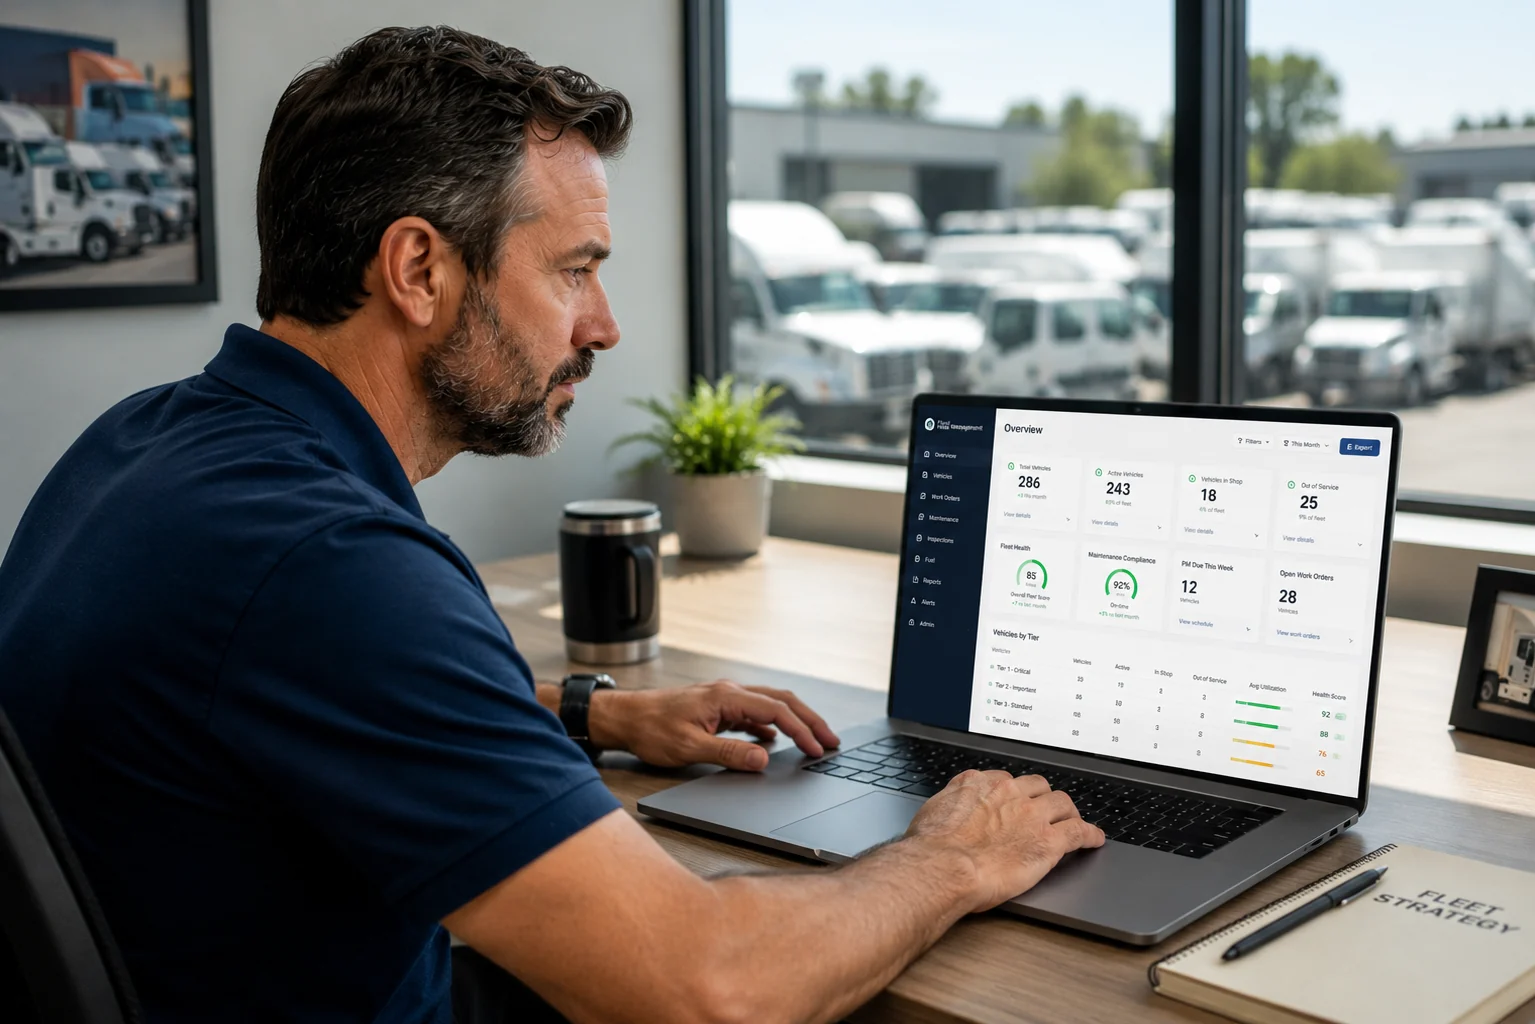
A few reliable indicators:
- PM schedules are being missed because there is no automated reminder system and someone forgot to update the sheet
- Compiling a fleet-wide maintenance report takes more than two hours of manual work
- You cannot quickly answer "which three vehicles cost the most to maintain this quarter?" without cross-referencing multiple tabs
- Different team members are recording the same data in different formats, making comparisons unreliable
- Fuel logs and maintenance records live in separate files with no connection between them
These are not discipline problems. They are scaling problems. For fleets in trucking and logistics or last-mile delivery, where vehicle turnover and route variability are high, the cost of staying on spreadsheets past the tipping point is especially steep.
Fix the System, Not the Metrics
The problem is almost never that you are tracking the wrong KPIs. The problem is that the infrastructure behind those KPIs is how data is captured, organized, segmented, and surfaced has not kept up with your fleet. A number is only as trustworthy as the system producing it. Fix the system, and the metrics take care of themselves.
Frequently Asked Questions
-
How many KPIs should a fleet manager actually track?
Industry best practice in 2026 is three to four primary KPIs visible at a glance, with diagnostic metrics accessible via drill-down. Tracking more than that without a layered dashboard structure leads to dashboard fatigue, where managers stop reading reports altogether. -
Why do fleet-wide averages hide expensive vehicles?
Averages flatten the distribution. In most mid-size fleets, a small number of vehicles account for a disproportionate share of total maintenance costs. When those costs are averaged across the entire fleet, the outliers disappear into the mean and stay invisible until the cumulative spend becomes undeniable. -
When should a fleet switch from spreadsheets to fleet management software?
The clearest signal is when compiling a report takes longer than acting on it. Other indicators include missed PM schedules, inability to compare individual vehicle costs quickly, and inconsistent data entry across team members. Most fleets hit this wall somewhere between 15 and 25 vehicles. -
What is the difference between a vanity metric and a business metric in fleet management?
A vanity metric looks good but does not drive decisions. Total miles driven is a vanity metric. Profit per mile or cost per mile by vehicle class is a business metric it tells you whether each vehicle is contributing to or eroding your margins. Growing fleets tend to accumulate vanity metrics and undercount the ones that actually matter. -
How does fleet size affect KPI lag time?
In a small fleet with manual entry, a maintenance event might appear on a report within a day or two. In a larger fleet with multiple data entry points, weekly reporting cycles, and more vehicles generating events simultaneously, the same information can take a week or more to surface. By the time the KPI reflects reality, the operational context has already changed.