Miya Bholat
Jul 7, 2026
What Slows Fleet Productivity Between Job Sites?

Fleet productivity slows between job sites when a finished vehicle does not move quickly into its next productive assignment. The delay usually comes from dispatch gaps, idle waiting, poor site coordination, missing vehicle status, or transit maintenance issues. Strong fleet performance management fixes it by connecting utilization, maintenance readiness, GPS visibility, and reporting. The average commercial fleet loses 15 to 20 percent of potential operating time to unplanned downtime, costing $448 to $760 per vehicle per day, so between job delays are measurable capacity leaks.
Key Takeaways
- Transit and idle time are overlooked productivity drains. Vehicles still consume fuel, labor, and asset life while moving, waiting, or staging between assignments.
- Dispatch gaps are a leading cause. When dispatch cannot see which vehicle is finished, nearby, and ready, trucks sit even when the schedule looks full.
- Reactive maintenance creates cascading delays. A breakdown between sites disrupts repairs, towing, replacement scheduling, and the next job.
- Poor visibility hides the problem. Without live status, managers often mistake coordination failure for a shortage of vehicles.
- Fleet management software closes the gap. Scheduling, tracking, inspections, maintenance alerts, and reports help teams recover capacity without adding assets.
The Hidden Cost of Time Between Jobs
Between jobs time includes driving to the next site, waiting at a gate, fueling, staging, and repositioning vehicles. Fixed costs still run. A 10 vehicle fleet with a 27.8 percent idle rate loses roughly a quarter of available capacity. Teams that track fleet utilization rate can separate real productivity from simple engine on time.
| Between jobs activity | What it costs | Management signal |
|---|---|---|
| Idling outside a site | Fuel, driver time, engine wear | Site timing or access issue |
| Waiting for dispatch | Labor and asset capacity | Available but unassigned vehicle |
| Repositioning vehicles | Miles, fuel, schedule time | Weak route planning |
| Breaking down in transit | Repair, towing, lost job time | Maintenance risk |
Fixed Costs Don't Pause When Productivity Does
A sitting vehicle still carries lease payments, depreciation, insurance, registration, driver wages, and fuel cost. The U.S. Department of Energy estimates that idling can burn 0.25 to 1 gallon of fuel per hour. That underutilization drives up cost per mile.
Watch these fixed cost areas when vehicles sit between jobs:
- Lease payments or depreciation
- Insurance and registration
- Driver wages and overtime exposure
- Fuel burned while idling
- Engine wear from idle hours
The Idle Rate Problem in Multi Site Fleets
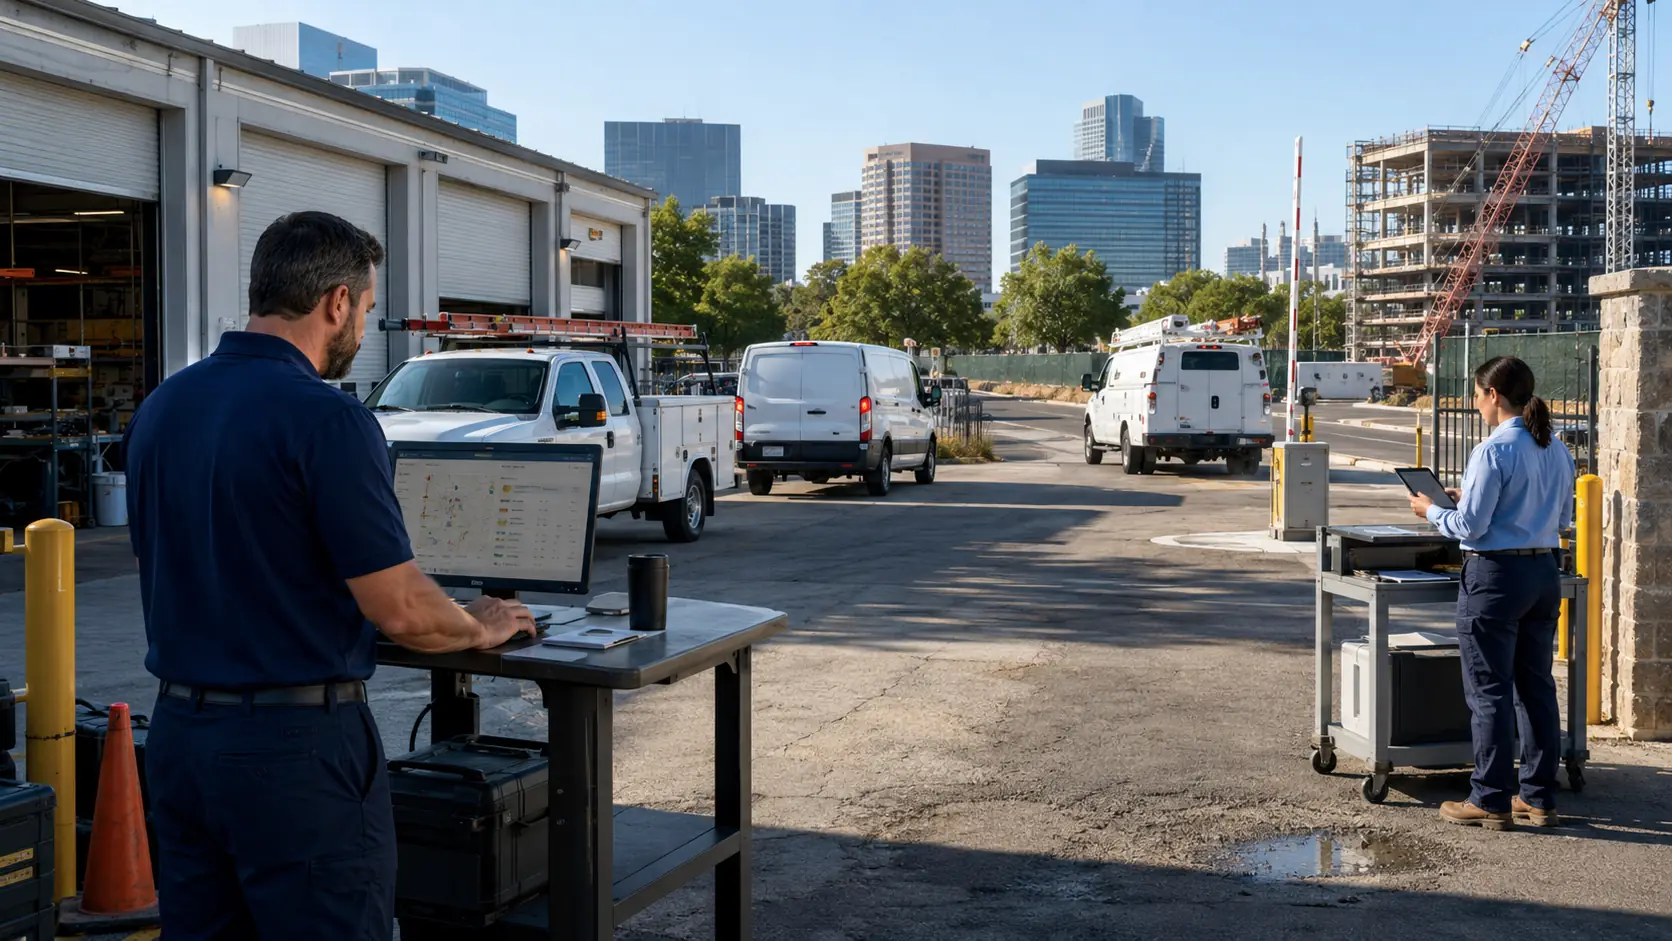
Multi site fleets usually show higher idle rates because every site adds handoffs, gate delays, staging time, and dispatch decisions. In construction fleet operations, crews and vehicles shift throughout the day, so a truck can finish early at one location while another site needs help. Identifying ghost capacity can recover 6 to 9 percent utilization within 30 days without buying more assets.
Dispatch Gaps and Scheduling Inefficiencies
Dispatch gaps form when a vehicle has finished work but has not received its next assignment. This is the core operational cause of lost between site productivity. Manual scheduling makes it worse because updates sit in calls, texts, spreadsheets, or paper logs. Manual tracking also overstates utilization by 8 to 14 percent because drivers often report shift hours rather than true operating hours.
Common causes of dispatch gaps include:
- Job completion updates arriving late
- Vehicle status living in separate systems
- Dispatchers lacking live location data
- Site managers changing schedules locally
- Drivers waiting for gate access, crews, or load instructions
Why Manual Dispatch Creates Structural Delay
Spreadsheets and paper logs do not communicate between sites. When one site finishes early and another needs a vehicle, the dispatcher becomes the bottleneck. Reducing time wasting tasks fleet managers should automate helps dispatchers act on live status instead of chasing updates. GPS supported dispatch can assign the closest ready vehicle faster.
The Cascading Effect of a Single Scheduling Miss
One missed reassignment rarely wastes only one hour. It can push the next arrival late, compress the schedule, and increase overtime. The final delay may look like a field issue, but the root cause often happened earlier in the day when the vehicle sat unassigned.
Unplanned Breakdowns Mid Transit
Reactive maintenance is especially costly when failure happens between job sites. A vehicle that breaks down in route creates repair cost, towing cost, lost work at the destination, and the scramble to redeploy another unit. Skipping oil changes and ignoring minor issues contributes to 45 percent of all breakdowns. Preventive maintenance reduces unplanned downtime by 25 to 30 percent, which is why automated fleet preventive maintenance schedules matter.
Why Breakdowns Happen Between Sites, Not At Them
Transit creates different stress than parked site work. Higher speeds, full loads, braking, vibration, and route changes can turn a marginal issue into a failure. A digital vehicle inspection app helps drivers catch defects before departure and proves whether the vehicle is ready.
Breakdown risk rises when teams ignore these warning signs:
- Repeated minor defects on the same vehicle
- Missed maintenance intervals
- Tire pressure or tread concerns
- Fluid leaks before departure
- Repair history showing recurring failures
Parts Delays Make Bad Worse
When a breakdown happens, parts availability controls downtime. Some critical parts carry lead times of more than 16 weeks, turning one repair into a capacity problem. Service history helps shops prioritize work and prepare for recurring needs. A connected parts inventory management software process helps teams avoid discovering a missing part only after the vehicle is down.
Poor Visibility Across Job Sites Makes Everything Harder
You cannot optimize what you cannot see. A vehicle may appear available in the system while it is actually fueling, waiting at a gate, driving back from a site, or sitting with the engine on. Without live status, dispatchers make decisions from assumptions, which creates redundant routes and unused capacity. Multi site operations with 3 terminals have shown utilization variance from 55 percent to 80 percent, a sign of coordination failure more than fleet size.
Better fleet GPS tracking software gives dispatchers location and status data before assigning the next job. It also helps managers see whether vehicles are moving, parked with engine on, or inactive.
The Ghost Vehicle Problem
Ghost vehicles are units that appear available in the fleet register but generate zero utilization. They still carry insurance, registration, ownership costs, and maintenance obligations. Real time asset maps show the true status of every vehicle. Strong fleet monitoring helps managers reassign, rotate, sell, or replace assets based on evidence.
Driver Behavior vs. System Failures: Know the Difference
Many fleet managers blame drivers for idle time too quickly. Some waste comes from behavior, but much between site idling comes from early arrivals, locked gates, slow crew readiness, dispatch holding patterns, and missing load instructions. Treating systemic idle as driver behavior creates friction and does not solve the cause. The better move is to separate needed idle from waste idle by site, time of day, job type, and vehicle status.
That distinction changes the fix. Site level idle points to access or crew readiness. Vehicle level idle may point to dispatch timing. Driver level idle may require coaching.
How Fleet Management Software Closes the Productivity Gap
A centralized platform closes the gap by connecting dispatch, GPS visibility, inspections, maintenance, service history, and reporting. The value is clarity. When a job ends, managers should see readiness, location, maintenance risk, and next assignment. AUTOsist supports this operating model through scheduling, service history, inspections, tracking, and reporting.
A fleet reports dashboard makes the productivity gap measurable by showing idle rate, utilization, downtime, and cost trends in repeatable reviews. The workflow should stay simple.
Maintenance Scheduling That Prevents Mid Route Failures
Preventive maintenance should follow mileage and engine hours, not only calendar dates. A vehicle that idles often and moves heavy loads may need service sooner than another vehicle of the same age. Automated alerts reduce the chance that a known issue follows the driver onto the road.
Real Time Data That Supports Smarter Dispatch
Live vehicle data collapses the gap between job done and next assignment. Dispatch can see which vehicle is closest, which one is still moving, which one is waiting, and which one should not be assigned because maintenance is due. Geofencing also shows how long vehicles sit at specific sites, so teams can fix scheduling and site readiness problems.

Measuring and Tracking Between Site Productivity
Fleet managers need a simple framework to measure the gap. Start with uptime percentage: Operational Time ÷ Total Available Time × 100. Compare it against idle rate, utilization rate, downtime, dispatch gap time, and site based delays. Do not count engine on time as productive time.
Track these weekly:
- Uptime percentage
- Idle rate by vehicle and site
- Utilization rate against the 85 to 95 percent optimal range
- Vehicles below 80 percent utilization
- Average gap between job completion and next dispatch
- Weekly idle cost trend by site
| Metric | Formula or signal | Action when weak |
|---|---|---|
| Uptime percentage | Operational Time ÷ Total Available Time × 100 | Review downtime causes and maintenance compliance |
| Idle rate | Idle time ÷ engine on time | Separate site delay from driver behavior |
| Utilization rate | Productive hours ÷ available hours | Reassign ghost capacity before adding vehicles |
| Dispatch gap | Job complete to next assignment | Improve status updates and dispatch visibility |
| Weekly idle cost trend | Idle hours × hourly idle cost | Identify repeat site delays and schedule fixes |
The best fleets review these patterns weekly, not only at month end. They adjust dispatch rules, site schedules, maintenance timing, and driver communication. Between job productivity improves when managers treat the gap as an operating metric.
Frequently Asked Questions
-
What slows fleet productivity between job sites the most?
The biggest productivity drain is the gap between one job ending and the next assignment starting. This usually happens when dispatch does not have live vehicle status, job completion updates, or location data. The vehicle may be available, but if no one knows it is ready, it sits idle while labor, fuel, and fixed costs continue. -
Why does fleet idle time increase between job sites?
Idle time increases between job sites because vehicles often wait for dispatch instructions, site access, crew readiness, loading, fueling, or route confirmation. Most of this is not a driver behavior issue. It is usually a scheduling, visibility, or coordination problem that shows up as wasted engine hours. -
How much does between site idle time cost a fleet?
Between site idle time costs more than fuel. A vehicle may burn 0.25 to 1 gallon of fuel per hour while idling, but the larger cost comes from paid labor, depreciation, insurance, and lost productive capacity. Across several vehicles, even small idle gaps can turn into hours of unused fleet capacity each week. -
How can fleet managers reduce time lost between job assignments?
Fleet managers can reduce lost time by tracking live vehicle location, requiring fast job completion updates, using proximity based dispatch, and reviewing idle patterns by site. The goal is to shorten the time between "job complete" and "next assignment issued." Weekly reporting helps identify the sites, vehicles, or schedules that create the most delay. -
What metrics should fleets track to improve between site productivity?
Fleets should track uptime percentage, idle rate, utilization rate, dispatch gap time, downtime, and idle cost by site. Utilization below 80 percent usually signals inefficiency, while 85 to 95 percent is a stronger operating range for many fleets. Teams should also avoid treating engine on time as productive time.