Hidden Cost of Poor Fleet Maintenance
Poor fleet maintenance does not only increase repair expenses; it creates indirect operational, safety, administrative, and asset-lifecycle costs that are often untracked. These hidden costs accumulate gradually and can exceed visible maintenance spend if preventive controls, documentation, and scheduling discipline are inconsistent.

Maintenance Maturity vs. Cost Outcomes
| Maintenance Maturity Level | Downtime Pattern | Data Quality | Cost Outcome |
|---|---|---|---|
| Reactive / Run-to-Failure | Frequent, unpredictable | Fragmented or missing | High total cost and disruption |
| Basic Preventive | Periodic but inconsistent | Partial records | Moderate cost with avoidable spikes |
| Structured Preventive | Planned and predictable | Centralized and searchable | Lower total cost and improved uptime |
| Controlled / Optimized | Rare and planned | Complete historical data | Lowest lifecycle cost and stability |
“Fix Fast” Culture vs. Controlled Maintenance Operations

Fix Fast Culture
- Repairs prioritized only after breakdowns
- Limited inspection documentation
- Parts ordered reactively
- Budget variability and repeat failures

Controlled Maintenance Operations
- Scheduled preventive work and inspections
- Standardized service records
- Parts planning and inventory visibility
- Predictable budgets and extended asset life
Unplanned Downtime and Service Disruption
Unplanned downtime is one of the most expensive consequences of poor maintenance because it interrupts routes, labor schedules, and customer commitments simultaneously. Even short breakdowns can cascade into missed deliveries, overtime, and contract penalties.
- Vehicle outages during peak operating hours
- Driver idle time and overtime wages
- Missed service windows or customer dissatisfaction
- Emergency towing and expedited parts shipping
- Secondary scheduling disruptions across the fleet
Operational outcome indicators:
- Increased daily vehicle unavailability
- Growing backlog of deferred repairs


Accelerated Wear and Reduced Asset Life
When inspections and preventive tasks are skipped or delayed, component wear accelerates. Tires, brakes, suspension systems, and powertrain components reach replacement thresholds earlier than expected, increasing total cost of ownership.
- Premature tire replacement cycles
- Higher brake and suspension repair frequency
- Engine and transmission strain due to unresolved faults
- Earlier vehicle retirement or resale value loss
- Increased fuel consumption from mechanical inefficiencies
Lifecycle outcome indicators:
- Declining resale value
- Shortened replacement intervals
Safety Exposure and Compliance Risk
Maintenance gaps elevate safety and regulatory exposure. Roadside inspection failures, incident investigations, and insurance claims often reveal missing records or overdue service items rather than isolated mechanical faults.
- Failed driver vehicle inspection reports (DVIRs)
- Roadside violations and citations
- Insurance premium increases after incidents
- Legal and administrative expenses
- Reputational damage affecting contract renewals
Risk outcome indicators:
- Rising compliance findings
- Increased claim frequency or severity


Administrative Waste and Decision Blind Spots
Manual tracking methods and incomplete service histories consume administrative hours and limit decision accuracy. When maintenance data is dispersed across spreadsheets, paper logs, or disconnected tools, managers cannot reliably forecast budgets or prioritize repairs.
- Duplicate data entry and record reconciliation
- Inability to verify completed services quickly
- Budget overruns from inaccurate forecasting
- Delayed approvals due to missing documentation
- Limited visibility into cost-per-vehicle trends
Decision outcome indicators:
- Reactive purchasing patterns
- Inconsistent maintenance prioritization
Final Takeaways
Hidden maintenance costs are typically the result of inconsistent scheduling, incomplete records, and delayed corrective actions rather than isolated repair expenses.
- Unplanned downtime multiplies labor, scheduling, and customer-service costs simultaneously.
- Deferred preventive work shortens asset life and increases replacement frequency.
- Safety and compliance gaps introduce legal and insurance liabilities.
- Fragmented documentation reduces forecasting accuracy and increases administrative labor.
- Structured preventive controls consistently produce lower lifecycle fleet costs.
AUTOsist Fleet Management Resources

Fleet Maintenance SOP Guide

Preventative Maintenance Guide for Fleet Operations
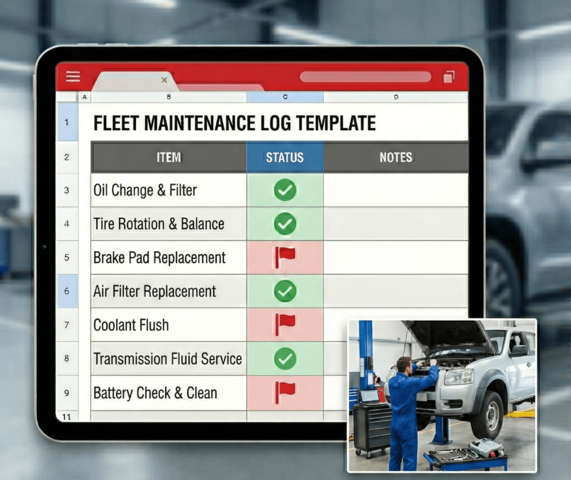
Fleet Maintenance Log Excel Template
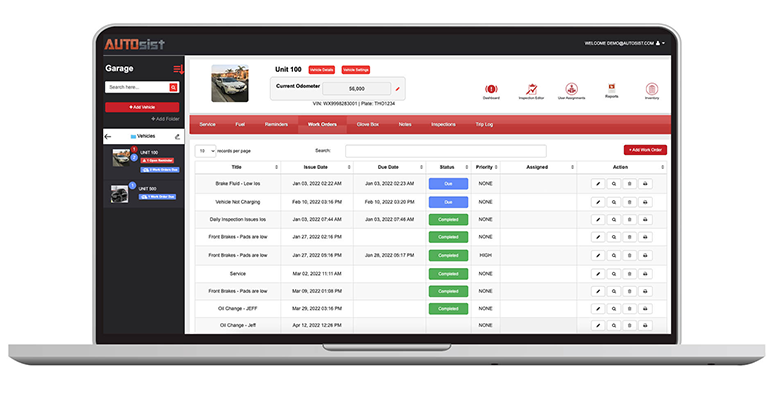
Fleet Maintenance Work Order Software