Miya Bholat
Jul 23, 2026
7 Driver Safety Signals Fleets Should Not Ignore
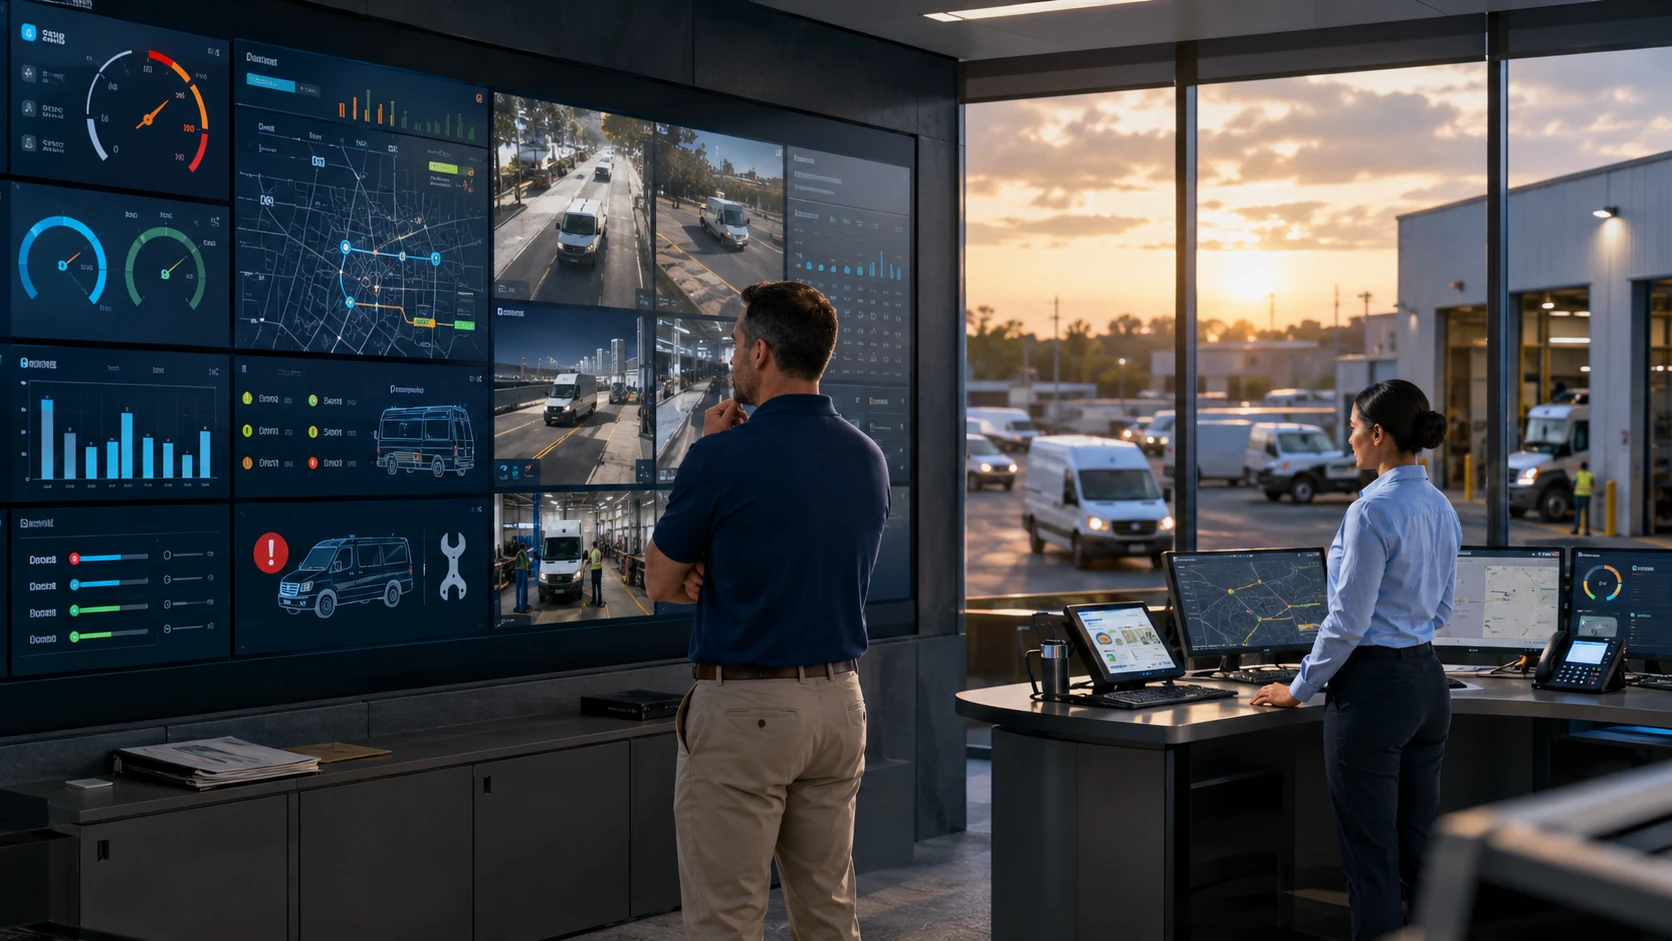
Driver safety signals are recurring behaviors or reporting gaps that warn a fleet manager about elevated crash risk, vehicle damage, maintenance costs, or policy violations. A strong fleet safety and compliance program connects those signals to coaching, inspections, maintenance actions, and documented follow up instead of waiting for a collision or roadside violation.
The most useful signals are not limited to speeding alerts. Harsh braking, aggressive acceleration, missed inspections, unexplained idling, unauthorized use, and unreported incidents can reveal problems while there is still time to correct them.
Key Takeaways
- Repeated behavior matters more than one event. A single harsh brake may be unavoidable, but a recurring pattern can indicate distraction, tailgating, or poor route awareness.
- Unsafe driving creates maintenance costs. Harsh braking, rapid acceleration, speeding, and excessive idling increase wear on brakes, tires, engines, and drivetrains.
- Incomplete inspections are a safety signal. Repeatedly missed or rushed inspections may reveal time pressure, driver disengagement, or a weak reporting culture.
- Context should determine the response. Thresholds must account for vehicle type, route conditions, traffic, weather, and operational requirements.
- Coaching should focus on patterns. Trend based conversations are more constructive than punishing drivers for isolated events without reviewing the circumstances.
- Safety and maintenance data should work together. Driver behavior should influence inspection intervals, work orders, maintenance planning, and vehicle risk reviews.
Why Driver Safety Signals Often Go Unnoticed
Fleets collect more information than ever, but data volume does not automatically produce safer decisions. Alerts often sit in one system, inspection results in another, and maintenance records somewhere else. Managers may investigate each data point separately without seeing the developing pattern.

A frequently cited NHTSA finding said the driver received the critical reason assignment in about 94 percent of crashes examined in an earlier national study. NHTSA has also clarified that a critical reason is not the same as proving the cause of a crash. The practical lesson is that driver actions remain an important area for prevention, but managers still need context before assigning responsibility.
The urgency was reinforced during CVSA Operation Safe Driver Week 2026, held from July 12 through July 18. The campaign focused on reckless, careless, and dangerous driving, including speeding, distraction, following too closely, unsafe lane changes, and fatigue.
Fleet managers should therefore watch for the following seven signals before they become expensive incidents.
7 Driver Safety Signals Your Fleet Cannot Afford to Miss
1. Repeated Harsh Braking Events
Harsh braking may signal distraction, following too closely, late hazard recognition, or poor route awareness. One event can be caused by a vehicle cutting into the lane. Several events across similar routes and shifts indicate a pattern that deserves review.
The maintenance effect is equally important. Frequent hard stops create additional heat and friction, which can accelerate brake pad and rotor wear. They may also place greater stress on tires and suspension components.
A practical response includes:
- Establish a weekly event threshold rather than reacting to every alert.
- Compare drivers operating similar vehicles and routes.
- Review location, traffic, and available camera context.
- Shorten brake inspection intervals when the pattern continues.
- Provide specific coaching based on when and where events occur.
2. Frequent Aggressive Acceleration
Repeated rapid acceleration can indicate impatience, schedule pressure, poor speed control, or an aggressive driving style. It may appear alongside speeding, sharp cornering, and harsh braking.
Aggressive acceleration also increases fuel use and places more stress on the transmission and drivetrain. The United States Department of Energy reports that aggressive driving, including rapid acceleration, braking, and speeding, can reduce fuel economy by 15 to 30 percent at highway speeds and 10 to 40 percent in stop and go traffic. Fuel efficient driving research provides a useful benchmark for evaluating the possible cost.
Managers should compare fuel consumption among drivers completing similar routes. A driver who consistently uses more fuel while operating the same vehicle class may need coaching, route review, or closer behavior monitoring through a fleet fuel management system.
3. Consistent Speeding Beyond Posted Limits
Consistent speeding can signal disregard for policy, habitual risk taking, unrealistic schedules, or pressure to complete more stops. It should not automatically be treated as a driver only problem. Dispatch practices and route planning may be contributing factors.
Speeding also increases stopping distance, tire wear, crash severity, and the potential cost of repairs. NHTSA reported that speeding contributed to 29 percent of United States traffic fatalities in 2024, resulting in 11,288 deaths. NHTSA speeding safety data also notes that excessive speed reduces vehicle control and increases crash severity.
Managers should review speeding by frequency, duration, road type, and amount above the limit. Persistent events on one route may require a scheduling change, while events across every route may indicate a coaching or policy issue.
4. Patterns of Missed or Incomplete Pre Trip Inspections
Repeatedly skipped, rushed, or identical inspection submissions can indicate complacency, time pressure, inadequate training, or disengagement from the safety process. These patterns matter even when no defect has been reported.
Incomplete inspections allow low tire pressure, brake concerns, fluid leaks, damaged lights, and other defects to remain hidden. Small issues can then become roadside failures, out of service conditions, or preventable repairs.
A digital vehicle inspection process makes reporting easier by allowing drivers to complete forms on their phones. Failed items can then connect directly to fleet maintenance work orders so reported defects reach the maintenance team without relying on paper handoffs.
5. Rising Idle Time Without Operational Justification
Idling may be necessary during loading, severe weather, power takeoff operation, or passenger service. A steady increase without an operational explanation can indicate unauthorized stops, weak route discipline, excessive warm up practices, or fatigue related breaks with the engine running.
The maintenance consequences include added engine hours, faster oil degradation, greater fuel consumption, and more frequent diesel particulate filter regeneration. Mileage alone may not reflect this wear.
Managers should use the following comparison:
| Review factor | What to compare | Possible explanation |
|---|---|---|
| Route | Drivers on the same route | Congestion or stop patterns |
| Shift | Similar operating hours | Break habits or dispatch delays |
| Vehicle type | Matching engine and duty cycle | Equipment requirements |
| Location | Repeated idle zones | Loading delays or unauthorized stops |
| Trend | Current period against prior periods | New behavior or process change |
Use GPS tracking and telematics data to identify where idling occurs, then confirm whether the time is operationally necessary before coaching the driver.
6. Recurring After Hours or Unauthorized Vehicle Use
After hours movement may reveal personal use, weak key control, policy violations, or an elevated liability risk. It also creates mileage and engine hours that may never reach the maintenance record.
Uncaptured use can cause preventive maintenance schedules to become inaccurate. A vehicle may appear to have several hundred miles remaining before service even though it has already crossed the correct threshold.
Useful controls include:
- Define authorized operating hours by team or vehicle.
- Create alerts for movement outside approved periods.
- Use geofences around homes, yards, and job sites.
- Investigate repeated events rather than occasional exceptions.
- Ensure all recorded mileage updates the maintenance schedule.
A fleet GPS tracking system can identify unauthorized movement, while an accurate vehicle service history preserves the mileage and maintenance context needed for follow up.
7. Spike in Unreported Minor Incidents or Near Misses
A rise in unreported scrapes, curb strikes, close calls, or minor damage can signal fear of punishment, weak reporting procedures, limited coaching, or poor risk awareness. Evidence may appear through repair requests, camera footage, inspection comments, or unexplained body damage.
Minor damage is not always cosmetic. A curb strike may affect wheel alignment, tires, steering, or suspension. A low speed contact event may damage sensors or mounting points even when the vehicle remains drivable.
Managers can improve reporting by creating a simple, nonpunitive process and separating honest reporting from reckless conduct. The response should include inspection of the affected area, documentation of the event, and trend review. The broader process is explained in what fleets should do after a driver near miss.
The Hidden Cost Connection: Driver Behavior and Vehicle Maintenance
Driver safety and vehicle maintenance should not operate as separate programs. Unsafe behavior changes how quickly parts wear, while poor vehicle condition changes how safely a driver can respond.
The relationship can be summarized as follows:
| Driver safety signal | Possible vehicle effect | Maintenance response |
|---|---|---|
| Harsh braking | Faster brake and tire wear | Shorten brake inspection interval |
| Rapid acceleration | Drivetrain stress and fuel loss | Review fuel and transmission trends |
| Speeding | Tire wear and greater crash damage | Inspect tires and suspension |
| Missed inspections | Defects remain unreported | Escalate incomplete forms |
| Excessive idling | Engine hours and oil degradation | Review service intervals |
| Unauthorized use | Untracked mileage | Correct maintenance schedule |
| Unreported incidents | Hidden structural damage | Trigger targeted inspection |
Consider an illustrative fleet with 50 vehicles and 10 drivers averaging three harsh braking events per working day. Across 260 working days, that equals 7,800 harsh braking events annually.
The event count does not prove that 7,800 repairs will occur. It does show why the fleet should examine brake wear by driver and vehicle. If persistent behavior causes just one additional $700 brake service for each of the 10 affected vehicles, the added annual expense would be $7,000, before downtime and related repairs.
A platform that connects driver monitoring, inspections, service reminders, GPS information, and maintenance records gives managers a clearer view of this chain. AUTOsist combines these areas so a safety alert can lead to inspection, coaching, and documented maintenance action instead of remaining an isolated notification.
How to Build a Signal Response System That Actually Works
A signal becomes valuable only when the fleet has a consistent method for reviewing and responding to it. The system should separate normal operational exceptions from recurring risk.
Set Thresholds, Not Zero Tolerance
Zero tolerance policies can create excessive alerts and encourage drivers to hide problems. Tiered thresholds provide a more balanced response.
For example, a fleet might classify events as:
| Level | Pattern | Response |
|---|---|---|
| Level 1 | Isolated event with clear context | Record and observe |
| Level 2 | Repeated events within one week | Manager review and coaching |
| Level 3 | Continued pattern after coaching | Formal improvement plan |
| Level 4 | Severe or deliberate violation | Immediate safety escalation |
Thresholds should vary by vehicle type, route, weather, traffic, and duty cycle. A school bus, delivery van, service truck, and emergency vehicle should not share identical alert settings.
Connect Safety Data to Maintenance Workflows
Every recurring driver signal should have a defined maintenance response. Repeated harsh braking should trigger an earlier brake inspection.

A rise in idling should prompt review of engine hours and oil service timing. A curb strike report should generate a tire, alignment, steering, and suspension check.
The workflow should look like this:
This connection prevents managers from addressing behavior while overlooking the mechanical consequences.
Coach Patterns, Not Single Events
One harsh stop may prevent a collision. Ten similar events in one week may reveal a behavior pattern. Managers should use driver behavior monitoring to identify trends without turning every alert into a disciplinary event.
Effective coaching should explain what happened, where it occurred, why it matters, and what the driver should do differently. The discussion should also allow the driver to identify route, scheduling, vehicle, or workload problems that contributed to the behavior.
From Warning Signs to a Safer Fleet: Putting It All Together
The seven signals are more than safety metrics. They are early warnings for maintenance costs, compliance exposure, vehicle downtime, insurance risk, and weaknesses in fleet culture.
Managers should review signals by driver, vehicle, route, shift, and time period. They should then connect recurring behaviors to coaching, inspections, work orders, and service adjustments. This creates a repeatable prevention process instead of a collection of disconnected alerts.
The goal is not to eliminate every event. It is to identify meaningful patterns early, understand their causes, and take proportionate action before the fleet experiences a serious incident.
Frequently Asked Questions
-
What are the most common driver safety warning signs in fleets?
Common warning signs include repeated harsh braking, aggressive acceleration, speeding, missed inspections, excessive idling, unauthorized vehicle use, and unreported incidents. Managers should look for recurring patterns rather than treating each event as proof of unsafe conduct. -
How does driver behavior affect fleet maintenance costs?
Driving behavior affects brake life, tire wear, fuel consumption, engine hours, drivetrain stress, and collision damage. Connecting safety trends to maintenance records helps managers identify vehicles that require earlier inspection or service. -
What should a fleet manager do about repeated harsh braking?
Review the frequency, location, traffic conditions, route, and available camera context. If the events form a pattern, provide targeted coaching and consider shortening the affected vehicle's brake inspection interval. -
How often should fleets review driver safety data?
High risk alerts may need daily review, while broader driver and vehicle trends should usually be reviewed weekly or monthly. The right cadence depends on fleet size, vehicle use, and the severity of the signals being tracked. -
What is the connection between pre trip inspections and driver safety?
Pre trip inspections help drivers identify defects before a vehicle enters service. Repeatedly missed or incomplete inspections may allow tire, brake, lighting, steering, or fluid problems to remain hidden until they cause a breakdown, violation, or incident.