 Miya Bholat
Jan 11, 2026
Fleet Management Analytics and Metrics: Data-Driven Guide for Fleet Managers
If you're managing a fleet without diving into your analytics and metrics, you're essentially driving with your eyes closed. The difference between a fleet that bleeds money and one that runs like a well-oiled machine often comes down to one thing: how well you track, analyze, and act on your data.
Fleet managers today have access to more data than ever before. But here's the catch—having data and knowing what to do with it are two very different things.
Fleet analytics help answer questions such as:
- Which vehicles cost more to keep than they're worth?
- Are we overspending on reactive repairs?
- Which drivers idle the most or waste the most fuel?
- How long are vehicles sitting in the shop?
- Which assets are underutilized and could be reassigned?
The right fleet management metrics and analytics can help you spot problems before they become expensive disasters, identify inefficiencies that are draining your budget, and make decisions based on facts rather than gut feelings.
Let's break down exactly which metrics matter, why they matter, and how you can use them to transform your fleet operations from reactive to proactive.
Why Fleet Management Analytics and Metrics Matter More Than Ever
Think about the last time you made a major decision about your fleet. Did you have solid data backing it up, or were you relying on hunches and anecdotal evidence? Modern fleet management isn't about guesswork anymore—it's about leveraging real-time data to make smarter decisions faster.
Fleet analytics give you visibility into every aspect of your operation. You can see which vehicles are costing you the most in maintenance, which drivers are exhibiting risky behaviors, and where you're wasting fuel. Without this visibility, you're operating blind, and that's expensive.
According to industry research, fleets that actively use data analytics report up to 20% reductions in operational costs and 15% improvements in vehicle uptime. These aren't marginal gains—they're game-changers that directly impact your bottom line.
Key Fleet Management Metrics Every Fleet Manager Should Track
Not all metrics are created equal. While it's tempting to track everything, you need to focus on the key performance indicators (KPIs) that actually move the needle for your operation.
With analytics, fleet managers are able to:
- prove where money is being spent
- identify waste before it spreads
- predict future budget needs
- justify fleet replacement decisions
- support compliance with organized records
Here are the metrics that consistently deliver actionable insights and help you make better decisions about your fleet.
Vehicle Utilization Rate
Your vehicles are expensive assets, and if they're sitting idle, they're not generating value—they're just depreciating. Vehicle utilization rate tells you how much of your fleet is actually being used productively. Calculate this by dividing the number of hours or miles a vehicle is in active use by the total available hours or potential miles. If you're seeing low utilization rates across multiple vehicles, you might be maintaining a larger fleet than you actually need, which means you're paying for insurance, registration, and maintenance on assets that aren't pulling their weight.
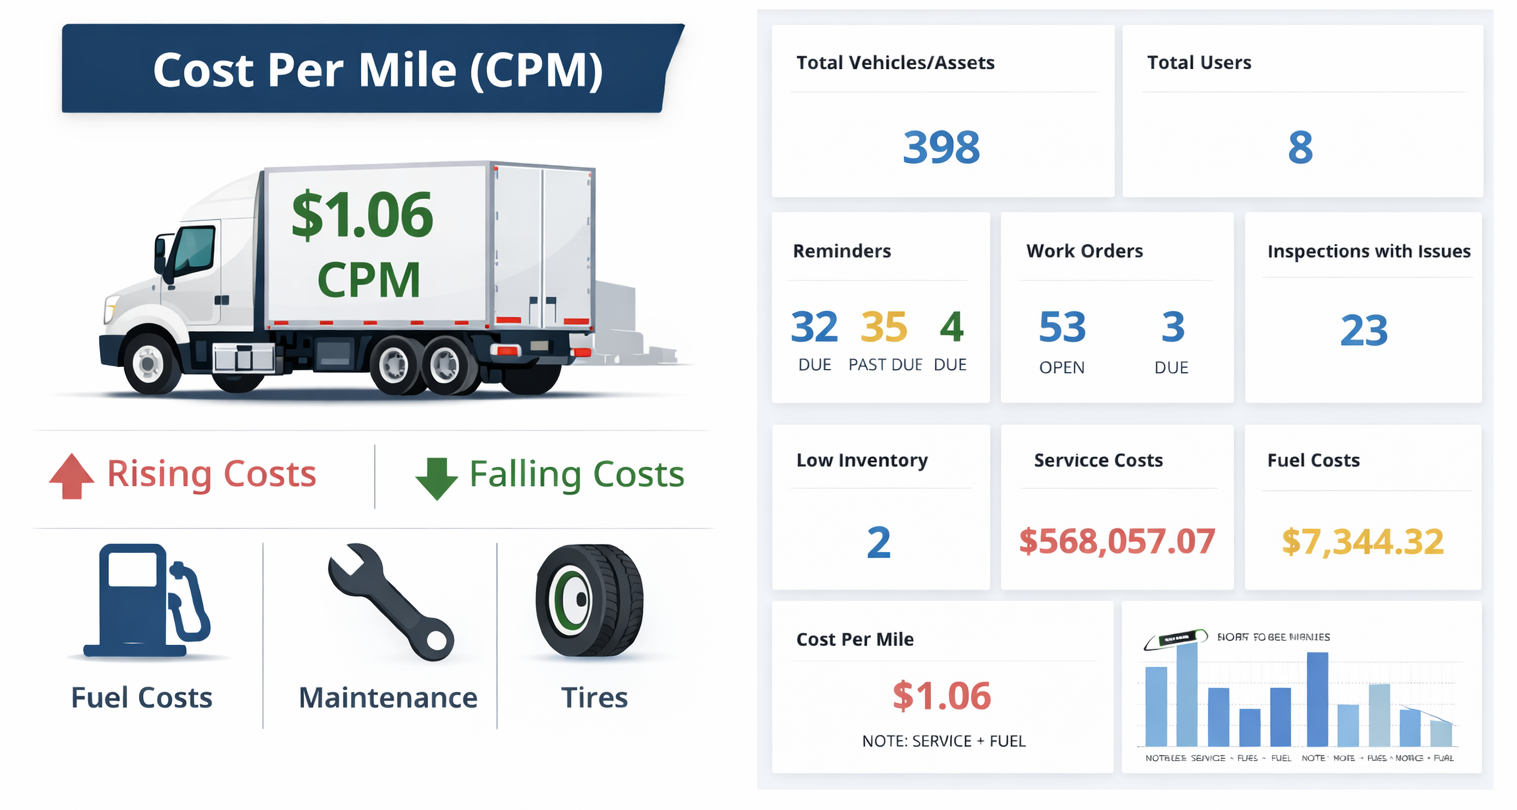
Cost Per Mile or Cost Per Hour
This is your fleet's efficiency benchmark. By calculating how much it costs to operate each vehicle per mile driven or per hour used, you get a clear picture of which vehicles are economical and which ones are money pits. This metric includes fuel, maintenance, insurance, depreciation, and any other operating costs. When you track this over time, you can identify trends—like a vehicle that's becoming increasingly expensive to maintain—and make informed decisions about repairs versus replacement.
Fuel Efficiency and Fuel Costs
Fuel typically represents one of the largest line items in any fleet budget, often accounting for 30-60% of total operating costs. Tracking fuel efficiency (miles per gallon or liters per 100km) across your fleet helps you identify vehicles that are underperforming and drivers who might benefit from additional coaching.
Analytics make it easy to see:
- changes in MPG
- excessive idle time
- sudden fuel spikes
- vehicles with declining efficiency
Also look for unexpected drops in fuel efficiency—they often signal mechanical issues before they become major problems. Modern fleet fuel management software can automatically track and alert you to these anomalies.
Fleet Maintenance Costs and Repair Frequency
How often are your vehicles in the shop, and how much is it costing you? This metric reveals patterns that can save you serious money. Track both preventive maintenance (scheduled services) and reactive maintenance (unexpected breakdowns). If you're seeing high reactive maintenance costs, it usually means your preventive maintenance program needs work. Vehicles that require frequent unscheduled repairs might be candidates for replacement, especially if repair costs are approaching the vehicle's current value.
Vehicle Downtime
Every day a vehicle sits in the shop is a day it's not generating revenue or completing necessary work. Downtime percentage measures how much time your vehicles spend out of service. Calculate this by dividing the number of days a vehicle is unavailable by the total days in your measurement period.
Before listing them, it’s useful to understand the goal — move from reactive firefighting to proactive planning. These metrics help:
- average days out of service
- number of road breakdowns
- repeat repair frequency
- time from defect report to work order completion
- overdue PM count
High downtime often stems from deferred maintenance catching up with you, unreliable vehicles, or inefficient repair processes. Understanding your fleet downtime patterns helps you identify the root causes and implement solutions.
Driver Safety Metrics
Safety should never take a backseat, and the data proves it's also good business. Track incidents, accidents, traffic violations, and near-misses. Beyond the obvious human cost, accidents drive up insurance premiums, damage your vehicles, create legal liability, and hurt your company's reputation.
Measure metrics like accidents per million miles, incidents per driver, and safety score trends. When you spot concerning patterns with specific drivers, you can intervene with targeted training before something serious happens.
How to Turn Fleet Data Into Actionable Insights
Collecting data is only half the battle. The real value comes from transforming that raw data into actionable insights that improve your operations. Here's how successful fleet managers make that happen consistently.
Establish Your Baseline
Before you can improve anything, you need to know where you stand. Start by documenting your current metrics across all the key areas we've discussed. This baseline becomes your benchmark for measuring progress. Without it, you're just collecting numbers without context. Take the time to get accurate baseline data—it's the foundation everything else builds on.
Set Realistic Targets
Once you know your baseline, set specific, measurable targets for improvement. Don't aim for perfection overnight—incremental improvements compound over time. For example, if your current fuel efficiency is 7 miles per gallon, aim for 7.5 mpg over the next quarter rather than jumping straight to 10 mpg. Realistic targets keep your team motivated and focused on achievable wins.
Create Regular Reporting Cadences
Data only helps you if you actually look at it regularly. Establish a reporting schedule that makes sense for your operation—maybe weekly reviews for critical metrics like safety incidents and fuel costs, and monthly deep dives into maintenance trends and utilization rates. Different stakeholders need different types of reports at different intervals. Your maintenance team might need daily work order reports, while executive leadership might prefer monthly summaries. Modern fleet management reporting tools can automate these reports and deliver them right when you need them.
Look for Patterns and Anomalies
Raw numbers tell you what happened. Patterns tell you why it's happening. When you review your metrics, look for trends over time. Is fuel efficiency declining gradually across all vehicles? That might indicate a fuel quality issue or driver behavior problem. Did one vehicle suddenly spike in maintenance costs? That's worth investigating immediately. Anomalies often signal problems that need urgent attention, while patterns reveal systemic issues that need strategic solutions.
Common Fleet Analytics Mistakes to Avoid
Even experienced fleet managers fall into certain traps when it comes to analytics. Avoiding these common mistakes will help you get more value from your data and make better decisions for your operation.
Tracking Too Many Metrics
When you try to track everything, you end up focusing on nothing. Analysis paralysis is real, and it happens when you're drowning in data but can't identify what actually matters. Start with the core metrics that directly impact your main objectives—usually cost reduction, safety improvement, and uptime optimization. You can always add more metrics later once you've mastered the basics. Quality beats quantity every time when it comes to fleet analytics.
Ignoring Data Quality Issues
Garbage in, garbage out. If your drivers aren't logging accurate odometer readings, if fuel receipts aren't being submitted properly, or if maintenance records are incomplete, your analytics will be worthless—or worse, misleading. Before you make major decisions based on your data, verify that the underlying information is accurate and complete. Invest time in training your team on proper data entry procedures and implement validation checks where possible.
Failing to Act on Insights
The biggest waste of data is collecting it and then doing nothing with it. When your analytics reveal a problem—say, a specific vehicle that's costing twice as much per mile as similar units—take action. Create a plan, assign responsibility, and follow through. Data without action is just expensive record-keeping. The fleets that see real ROI from analytics are the ones that build a culture of data-driven decision making where insights lead to concrete changes.
How AUTOsist puts analytics to work in everyday fleet operations
Let's be honest—tracking all these metrics manually is nearly impossible if you're managing more than a handful of vehicles. Spreadsheets might work for small operations, but they quickly become unwieldy, error-prone, and time-consuming as your fleet grows. This is where modern fleet management software becomes essential.
The right software automatically collects data from multiple sources—telematics devices, fuel cards, maintenance shops, driver logs—and consolidates everything into a single dashboard. You get real-time visibility into your entire operation without manually compiling reports or hunting down information. Automated alerts notify you when metrics fall outside acceptable ranges, so you can address problems proactively instead of discovering them weeks later during a monthly review.
AUTOsist's fleet management system provides comprehensive analytics and reporting tools specifically designed for fleet managers who need actionable insights without the complexity. The dashboard gives you at-a-glance visibility into your most important metrics, while detailed reports let you drill down into specific vehicles, drivers, or time periods. Custom alerts ensure you never miss critical events, and automated reports get delivered to the right people at the right time.
The system integrates with popular telematics providers and fuel card systems, automatically pulling in data so you don't have to enter it manually. Everything from maintenance schedules to fuel consumption to driver behavior gets tracked automatically, giving you a complete picture of your fleet's performance. When it's time to make decisions about vehicle replacements, budget planning, or operational changes, you'll have all the data you need right at your fingertips.
Getting Started With Fleet Analytics and AUTOsist
If you're not currently tracking these metrics—or if you're tracking them but not using them effectively—here's how to get started on the right foot. The key is to start simple and build from there, rather than trying to do everything at once and getting overwhelmed.
First, choose three to five core metrics that align with your biggest operational challenges. If unplanned downtime is killing your productivity, focus on maintenance frequency, vehicle downtime, and cost per mile. If fuel costs are out of control, prioritize fuel efficiency, fuel costs per vehicle, and driver behavior metrics. Start where the pain is greatest and where improvements will have the most impact.
Next, ensure you have reliable systems for collecting accurate data. This might mean implementing better procedures for odometer readings, setting up fuel card integrations, or training your maintenance team on proper work order documentation. Good data quality is non-negotiable—without it, your analytics are built on sand.
Then establish your baseline measurements and set realistic improvement targets. Share these targets with your team so everyone understands what you're trying to achieve and why it matters. When people understand how their actions impact the metrics, they're more likely to make choices that move the numbers in the right direction.
Finally, commit to regular review and action. Schedule time on your calendar to review your metrics—don't just wait for spare moments that never come. When you identify issues or opportunities, create action plans with specific owners and deadlines. Track whether your interventions are working by monitoring how the metrics change over time.
Key Takeaways
Fleet management analytics transform how you run your operation by replacing guesswork with data-driven decision making. Here's what matters most:
Focus on metrics that drive real business outcomes. Vehicle utilization, cost per mile, fuel efficiency, maintenance costs, downtime, and safety metrics give you the clearest picture of fleet performance and identify where improvements will have the biggest impact on your bottom line.
Data collection is worthless without action. Establish baselines, set realistic targets, and create regular reporting cadences. When your analytics reveal problems or opportunities, follow through with concrete action plans and monitor the results to ensure your interventions are working.
Technology eliminates the manual burden of analytics. Modern fleet management software automatically collects, consolidates, and analyzes data from multiple sources, giving you real-time visibility and automated alerts without the time-consuming work of manual tracking and reporting.
Quality beats quantity in fleet analytics. Start with a handful of critical metrics rather than trying to track everything. Master the basics first, ensure your data quality is solid, and avoid analysis paralysis by focusing on what truly matters for your operation.
Analytics reveal patterns that predict problems. Regular review of your metrics helps you spot trends and anomalies before they become expensive disasters. Gradual declines in performance often signal systemic issues, while sudden spikes indicate urgent problems that need immediate attention.