Miya Bholat
Aug 17, 2026
6 Maintenance Labor Gaps That Delay Repairs
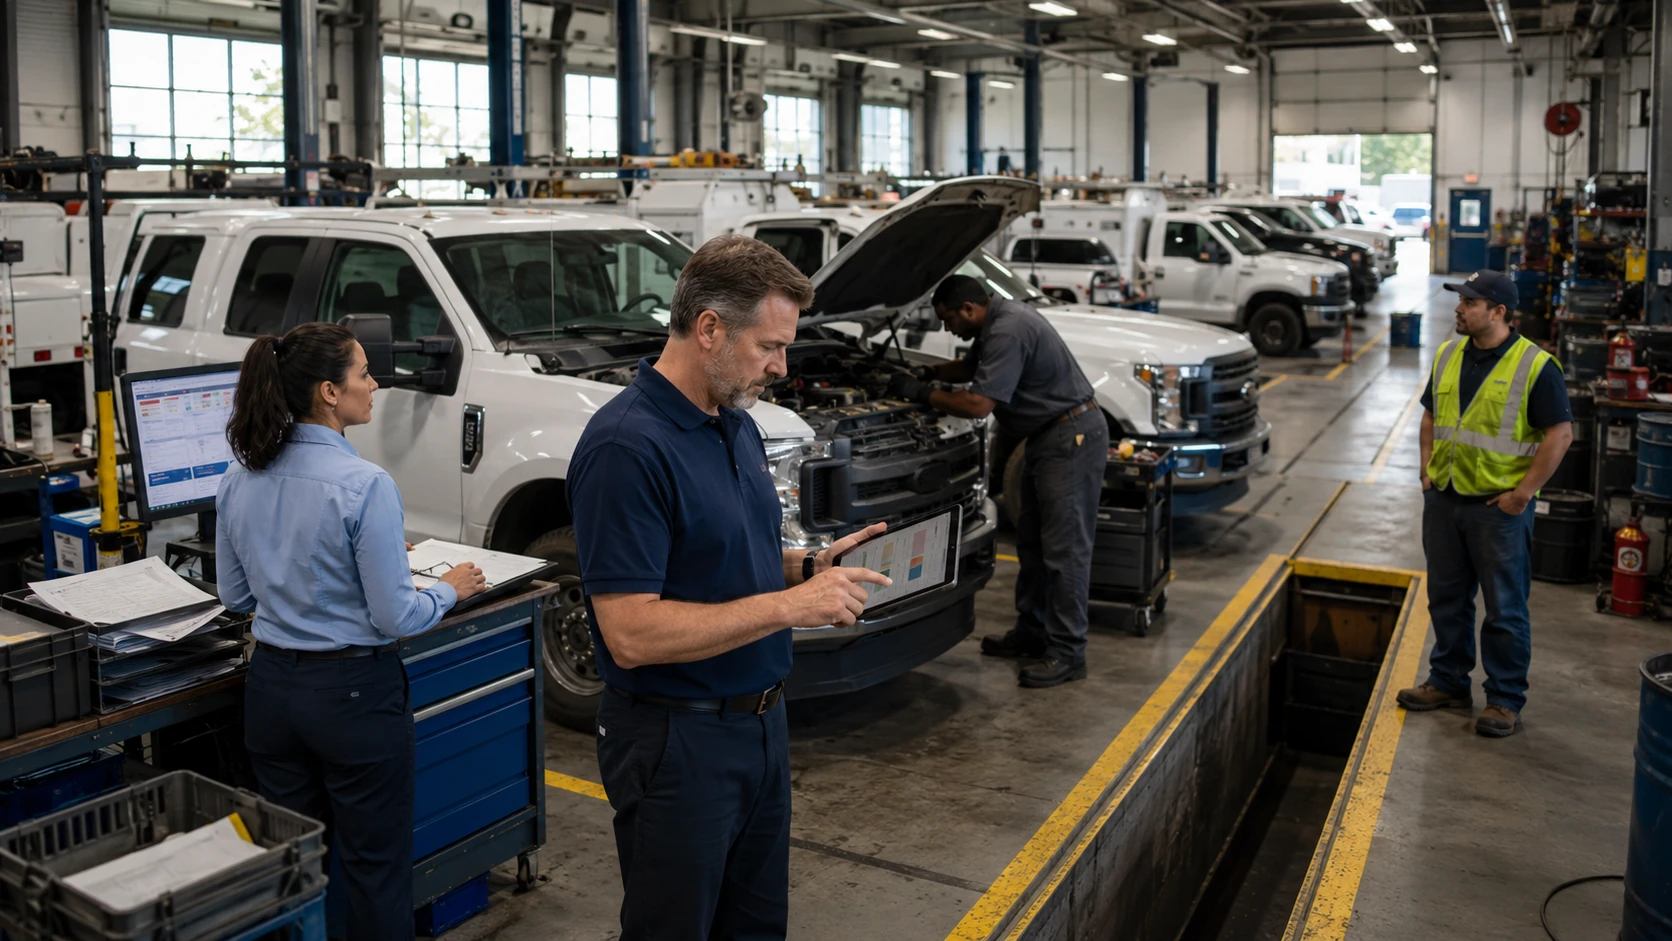
Maintenance labor gaps are shortages or inefficiencies that reduce the hours, skills, or coordination available to complete repairs. Fleets can close them by measuring technician capacity, training, wrench time, job assignment, turnover, and vendor performance through fleet maintenance software. When managers can see where labor time disappears, they can shorten repair queues without assuming every delay requires another hire.
Key Takeaways
- Vacancies reduce real shop capacity. Open positions create longer repair queues, deferred preventive maintenance, and more idle vehicles.
- Skills mismatches slow diagnosis. Modern equipment requires diagnostic, electrical, software, and telematics knowledge that many new technicians still need to develop.
- Low wrench time wastes existing capacity. Waiting for parts, records, approvals, and instructions can consume more of a shift than hands on repair work.
- Weak assignment creates hidden delays. A shop may have enough technicians but still route work too slowly or send jobs to people without the right skills.
- Turnover removes institutional knowledge. Every departure takes vehicle history, repair judgment, and mentoring capacity out of the shop.
- Unmeasured vendor labor remains a blind spot. Fleets need comparable turnaround, cost, and rework data for outsourced repairs.
- Diagnosis should come before hiring. A labor dashboard can show whether the main constraint is headcount, capability, workflow, retention, or vendor performance.
- Every gap compounds downtime. Only 9.7 percent of fleets report consistently completing maintenance on time, according to the 2026 Fleet Benchmark Report.
Why Labor Gaps Cost More Than Parts Delays
Parts delays are visible because a vehicle sits while the team waits for a component. Labor delays hide inside queues, approvals, incomplete work orders, poor routing, and repeated diagnosis. Communication gaps affect 31.5 percent, while unscheduled service volume affects 25.2 percent.
The NPTC 2025 Benchmarking Survey found that the average breakdown took about 20 hours to resolve, compared with roughly 15.8 hours in the prior year. Parts explain some of that increase, but labor capacity and coordination determine how quickly a shop diagnoses the failure, approves work, finds parts, and returns the unit to service. Managers need to treat labor as its own diagnostic category, especially when fleet downtime reduction practices fail to improve turnaround.
Gap 1: Technician Vacancy Rates That Shrink Shop Capacity
ATRI research on the diesel technician shortage found that 65.5 percent of diesel shops were understaffed in 2025. The average vacancy rate was 19.3 percent across all respondents and 24.5 percent among understaffed shops. Fullbay reported that 54 percent of shops were understaffed, while 40 percent of owners said hiring had become harder.
| Source | Metric | Figure |
|---|---|---|
| ATRI 2025 | Diesel shops understaffed | 65.5% |
| ATRI 2025 | Average vacancy rate | 19.3% |
| ATRI 2025 | Vacancy rate at understaffed shops | 24.5% |
| Fullbay 2026 | Shops reporting understaffing | 54% |
| BLS | Projected annual diesel technician openings | About 26,500 |
| Industry estimate | Annual technician shortfall | About 17,000 |
The BLS outlook for diesel service technicians currently projects about 26,500 openings each year. Industry research estimates a yearly shortfall near 17,000 technicians and about $2.4 billion in lost revenue. For a fleet, the practical result is simple: fewer technicians create longer queues, delayed service, and vehicles sitting idle before anyone touches them.
Gap 2: Skills Mismatch Between Vehicle Complexity and Technician Training
The Training Pipeline Problem
ATRI found that 61.8 percent of diesel technicians enter the field without formal training. Employers then invest an average of 357 training hours and $8,211 in trainese wages. Shops also rated more than 30 percent of program graduates unqualified across 20 core skill areas.
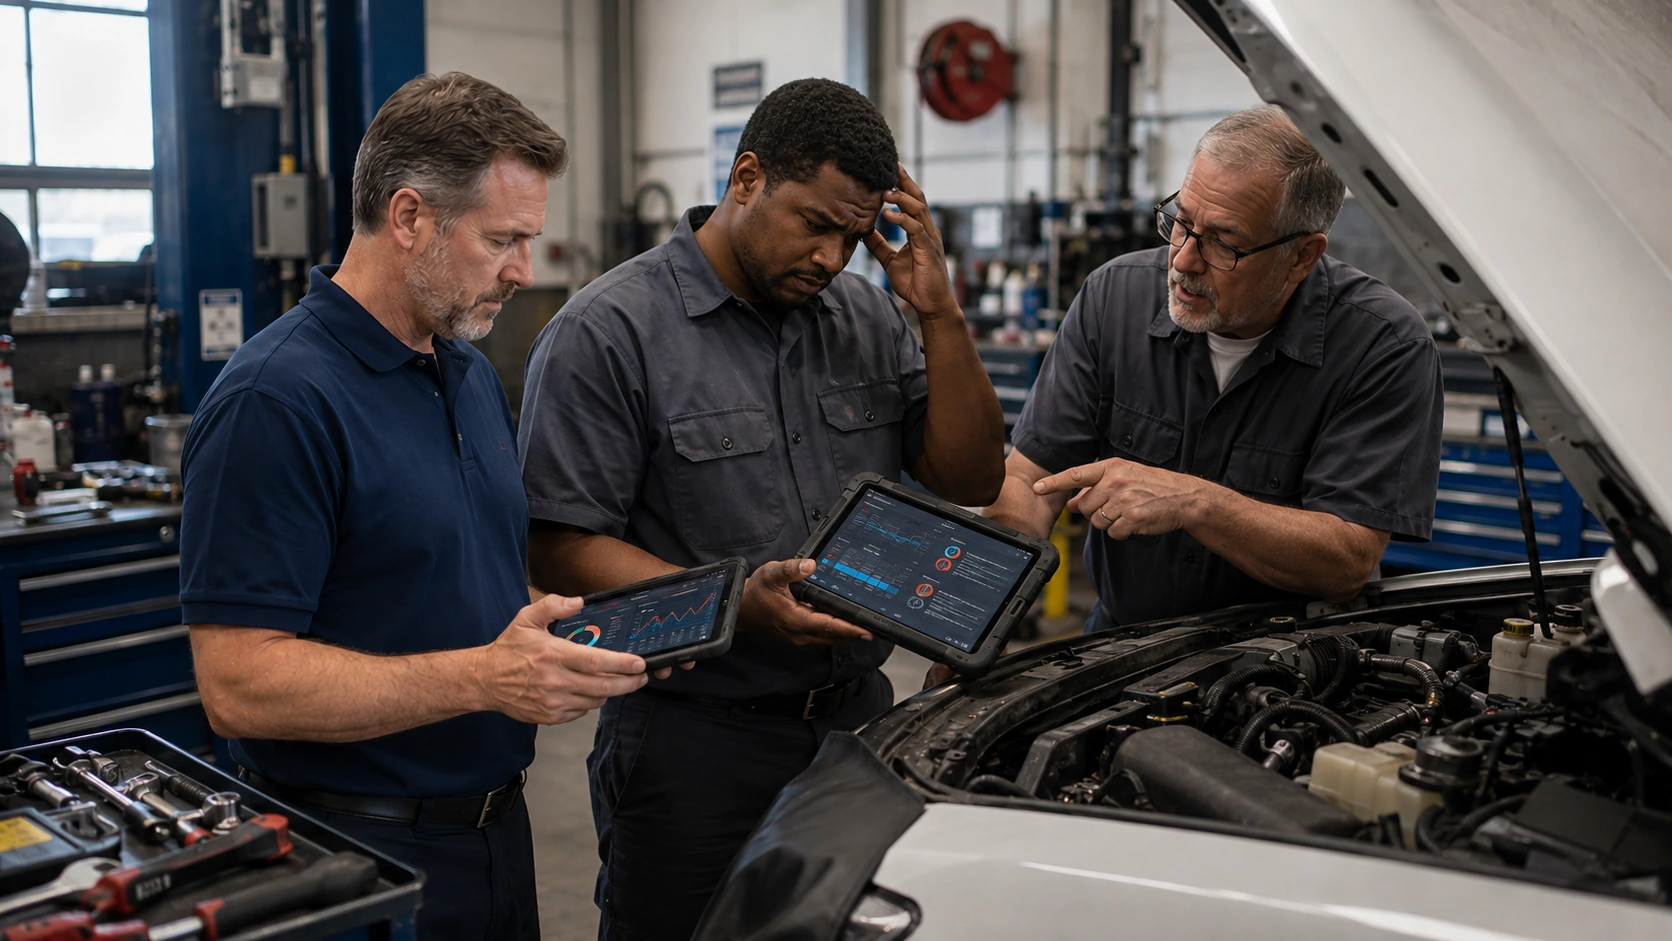
Modern technicians need more than mechanical ability. Common capability gaps include:
- Electronic fault diagnosis
- Telematics data interpretation
- Advanced electrical troubleshooting
- Hybrid and alternative fuel systems
- Digital repair documentation
Senior technicians often absorb the difference, which reduces their own repair output. Clear vehicle service history records help newer employees review earlier symptoms, repairs, and parts before escalating a job.
What This Means for Repair Turnaround
An inexperienced technician may spend longer isolating a fault, replace the wrong component, or pull a senior technician away from another bay. Industry estimates associate underqualified staffing with about 16 percent more rework and warranty claims.
The delay spreads through the shop in several ways:
- Diagnosis takes longer
- Senior technicians lose focused repair time
- Misdiagnosis consumes parts and bay capacity
- Rework pushes scheduled maintenance backward
Better repair request details give technicians symptoms, operating conditions, photos, and urgency before diagnosis begins.
Gap 3: Low Wrench Time and Nonproductive Labor Hours
Wrench time measures the share of a paid shift spent performing hands on repair work. Industry estimates place average fleet technician wrench time near 32 percent. Reactive shops often operate between 25 and 35 percent because information and materials do not reach the bay when needed.
A typical loss sequence looks like this:
- Retrieve parts. The technician leaves the bay or waits while staff confirm stock.
- Find information. The technician searches for service history, fault details, or prior repairs.
- Wait for approval. Work pauses while a supervisor reviews cost or scope.
- Document the job. Paper forms or duplicate entry consume repair time.
- Move between bays. Poor staging adds travel and setup time.
This is often the fastest labor gap to close because it does not require a new hire. Connected fleet maintenance work orders can place instructions, status, labor, and approvals in one record. A digital vehicle inspection process can also send clear defects and supporting photos directly into the repair workflow.
Gap 4: Work Order Assignment and Scheduling Gaps
The 6.7 Day Average That Hides in Plain Sight
Industry reports a median delay of 31 minutes between work order creation and technician start, but an average of 6.7 days. That difference signals a long tail of jobs waiting for assignment, priority, or shop capacity.
Common assignment failures include:
- No shared priority rules
- Manual dispatch that depends on one person
- Delayed notification of new work
- No live view of technician workload
Managers should track time to assignment and time to start separately. If assignment happens quickly but work starts late, capacity may be the problem. If assignment itself takes days, routing is the problem.
Matching the Right Tech to the Right Job
A brake specialist assigned to an electrical fault loses time. A junior technician assigned to a complex drivetrain repair may need repeated help. Skill based routing should consider certifications, experience, current workload, and job urgency.
Teams can also use preventive maintenance schedules to forecast routine demand, protect bay time, and avoid mixing every planned service with emergency work.
Gap 5: Technician Turnover That Resets Institutional Knowledge
ATRI found average annual technician turnover of 16.5 percent. Turnover reached 18.1 percent at understaffed shops, compared with 7.8 percent at fully staffed shops. The same research found that 44 percent of diesel technicians were considering a move to automotive, agriculture, or construction roles.
Pay matters, but technicians also evaluate:
- Supervisor quality and mentorship
- Career growth and training
- Task variety and modern equipment
- Tool costs and workplace conditions
Fullbay reported that median technician wages rose 14.1 percent to $36.50 per hour, yet shops still struggled to hire. Only 17 percent of respondents were age 30 or younger. The pattern supports the conclusion that pay alone cannot repair weak culture, unclear progression, or constant overload.
Turnover also removes knowledge that may never appear in a spreadsheet. Complete records can preserve that context and help fleets track maintenance without adding staff when experienced employees leave.
Gap 6: No Visibility Into Outsourced Labor Performance
Many fleets outsource an estimated 40 to 60 percent of repairs but cannot compare vendor turnaround, labor cost, repair quality, or rework.

That creates a labor blind spot because the fleet pays for capacity it cannot evaluate.
Track these vendor measures by repair category:
- Time from authorization to completion
- Labor hours and labor cost
- Repeat repair rate
- Days out of service
- Estimate variance
If one vendor takes three days longer for similar brake work, managers need that evidence before routing the next vehicle. Connected work orders, service history, and fleet reporting dashboards turn separate invoices into a usable performance record. Fleets experiencing repeated delays can also compare the causes described in vendor repair delays fleet teams can prevent.
How to Diagnose Your Fleet's Labor Gaps Before They Compound
Run this self audit every quarter using a consistent 12 month reporting window:
- Calculate vacancy rate. Divide open technician positions by total approved technician positions.
- Measure training investment. Record hours, wages, mentoring time, and time to independent productivity for each new hire.
- Measure wrench time. Compare hands on repair hours with total paid technician hours.
- Compare creation and start times. Track how long every work order waits before assignment and before actual work begins.
- Calculate turnover. Divide technician departures during the past 12 months by average technician headcount.
- Score vendors. Compare turnaround, cost, estimate variance, and rework for similar repairs.
- Find the primary constraint. Decide whether hiring, training, information flow, routing, retention, or outsourcing causes the largest delay.
AUTOsist can surface much of this evidence through work orders, service history, and reports. Pair the labor audit with five fleet maintenance gaps that cause breakdowns to identify process failures that may be increasing the burden on limited labor.
Frequently Asked Questions
-
What is the biggest labor gap in fleet maintenance right now?
Technician availability is a major constraint, but communication gaps affect an even larger share of fleets in 2026 benchmark. Managers should measure both headcount and lost labor time before choosing a solution. -
How does low wrench time increase fleet repair delays?
Low wrench time means paid technicians spend too much of their shifts waiting for parts, information, approvals, or assignments. The shop completes fewer repairs even when staffing levels remain unchanged. -
Why does technician turnover cost more than the replacement hire?
Turnover removes diagnostic experience, vehicle knowledge, mentoring capacity, and productivity. The replacement also needs training and time before handling complex work independently. -
How can fleet managers track outsourced repair labor performance?
Record each vendor's turnaround time, labor cost, estimate variance, rework, and days out of service by repair type. Compare similar jobs before assigning future work. -
What is the average time from work order creation to technician start?
Industry 2026 report shows a median of 31 minutes and an average of 6.7 days. The wide gap indicates that a smaller group of neglected jobs waits several days and pulls the average upward.