Miya Bholat
Oct 16, 2026
School Bus Fleet Size: How Many Buses Does a District Need?

A school district needs enough buses to complete every required student route on time, but there is no universal number based on enrollment alone. The correct school bus fleet size depends on eligible riders, route capacity, geography, and especially how many routes each bus can serve through staggered school bell times. Effective school bus fleet management starts by calculating the buses needed during the busiest operating period, then adding separate capacity for breakdowns and maintenance.
Key Takeaways
- Bell schedules drive fleet size. Staggering school start times allows one bus to complete multiple routes instead of requiring a separate bus for each route.
- No universal student ratio exists. Two districts with identical enrollment can need very different numbers of buses because of geography, eligibility, and scheduling.
- Route demand determines the active fleet. Calculate the routes required in each time window, then determine how many buses can realistically serve multiple windows.
- Driver availability limits usable capacity. Owning enough buses does not guarantee enough qualified drivers to operate them.
- Fleet data supports better decisions. Route mileage, vehicle utilization, and maintenance records help districts justify purchases and identify unused capacity.
Why There Is No Universal "Buses Per Student" Number
The United States operates approximately 480,000 school buses, according to the World Resources Institute's 2026 electric school bus research. Yet that national fleet total cannot establish an appropriate buses per student ratio for an individual district.
Consider two districts with 5,000 students. One serves a compact urban area where many students walk to school. Another covers several rural communities with long travel distances. Even if both transport the same number of students, their bus requirements can differ substantially.
Dividing enrollment by bus seating capacity produces a minimum number of passenger loads, not the number of vehicles required.
The Variables That Actually Decide Fleet Size
Transportation directors should separate student demand from vehicle requirements.
The main variables are:
- Eligible ridership: How many students qualify for transportation and actually use it?
- Bus capacity: How many passengers can safely occupy each vehicle under the applicable seating and equipment requirements?
- Geography: How far must buses travel between stops, schools, and depots?
- School bell times: Can the same bus serve another school before its arrival deadline?
- Special transportation: Which students need accessible vehicles, attendants, or additional boarding time?
Maintenance readiness also matters. A district may own enough buses but regularly lose operating capacity to unresolved defects. These problems are discussed in school bus fleet problems that delay morning routes.
District Owned vs Contracted Fleets
District owned fleets require transportation departments to budget for vehicle purchases, drivers, maintenance, insurance, and replacement.
Contracted transportation changes who supplies and operates the buses, but it does not eliminate the need to calculate route demand.

A district using contractors should distinguish dedicated buses, shared vehicles, and capacity guaranteed under its transportation agreement. Otherwise, it may count vehicles that are unavailable during peak hours.
The Real Driver of Fleet Size: Bell Schedule Tiers
Bell schedule tiers determine whether a bus serves one school or several schools during the same morning or afternoon transportation period.
A single tier system generally requires buses to complete their school arrival routes within one overlapping window. A two tier system creates two successive windows. Three tiers can allow one bus to transport high school, middle school, and elementary students consecutively.
Some districts use four or five tiers, although longer operating periods and tighter scheduling can limit the practical benefit.
How Tiering Multiplies Each Bus's Coverage
Suppose a district operates 72 morning routes. The theoretical bus requirement changes as follows when routes are distributed evenly and buses can complete consecutive assignments.
| Bell Schedule | Morning Routes | Minimum Active Buses |
|---|---|---|
| 1 tier | 72 | 72 |
| 2 tiers | 72 | 36 |
| 3 tiers | 72 | 24 |
These are idealized minimums, not guaranteed fleet requirements. Every bus must have enough time to finish its current route, unload students, travel to its next pickup, and reach the next school before its bell.
Actual trip duration matters more than the number of tiers printed on a timetable. GPS tracking and telematics can help transportation teams compare vehicle movement and travel times against planned schedules.
The savings can be substantial. During its 2025 bell schedule review, a Colorado school district explained that retaining its existing schedule would require 26 additional drivers, with an estimated $780,000 in salary and benefits.
The district described this in its official bell schedule questions and answers.
The important point is not that every district can cut its fleet by half. It is that bell scheduling can change the number of buses and drivers needed without changing student enrollment.
The Trade Offs Districts Accept for Fewer Buses
More tiers can introduce earlier pickups, later afternoon dropoffs, longer driver shifts, and conflicts with athletics or childcare.
They also create operational dependencies. If one bus finishes its first route late, its next school may experience delays.
A district should evaluate these risks alongside fleet savings. High fleet utilization rates only represent improvement when buses still meet arrival times, passenger capacity requirements, and safety expectations.
How to Calculate the Number of Buses Your District Needs
Start with student transportation demand, calculate the required routes, and then determine how many of those routes can share buses.
The basic starting estimate is:
Active buses = Total compatible morning routes ÷ Effective bell tiers, rounded up
However, this calculation assumes routes can be distributed across tiers and operated consecutively. The confirmed requirement must also meet the busiest tier's simultaneous vehicle demand.
Step by Step Fleet Sizing Workflow
Use the following numbered process before preparing a vehicle purchase or transportation budget.
Complete the calculation separately for afternoon service. The larger feasible vehicle requirement generally determines the normal active fleet.
A Worked Example for a Mid Size District
Suppose a district expects 3,600 students to ride buses daily and uses 60 passengers as its planning capacity for standard routes.
The basic passenger capacity calculation gives:
3,600 ÷ 60 = 60 busloads
However, individual schools, pickup locations, and travel distances prevent every bus from operating at full capacity. After designing its routes, the district establishes the following morning schedule.
| Bell Tier | Routes Required | Arrival Window |
|---|---|---|
| High schools | 24 | 7:15 AM |
| Middle schools | 20 | 8:00 AM |
| Elementary schools | 24 | 8:45 AM |
| Total | 68 | 3 tiers |
A simple calculation produces:
68 ÷ 3 = 22.67, rounded up to 23 buses.
But 23 buses are not sufficient, because the first and third tiers each require 24 buses operating simultaneously.
The correct theoretical active requirement is therefore 24 buses, assuming those buses can complete their assigned sequences within all three time windows.
The district should verify that a bus finishing its high school route can reach its middle school pickup on time, and subsequently complete its elementary assignment.
If travel times prevent that sequence, the district must add active vehicles or redesign the routes.
The calculation shows why 3,600 riders do not automatically require 60 separate buses, but also why dividing 68 routes by three without checking peak demand gives the wrong result.
Accurate trip and mileage tracking provides useful operating data for checking how long assigned vehicles actually spend traveling between locations.
Adjusting for Special Needs, Activity Trips, and Geography
A standard bus capacity calculation does not capture every transportation requirement.
Students who require wheelchair accessible vehicles, attendants, specialized seating, or additional boarding assistance may need dedicated routes with substantially lower passenger counts.
Rural districts face a different constraint. A bus may serve only a small group of students because collecting additional riders would create excessive travel times. Longer distances also make consecutive bell tiers harder to operate.
Urban districts may achieve higher passenger density, but congestion and limited loading space can reduce the time available between routes.
Athletic events, field trips, and other activity transportation create additional demand. A bus assigned to an afternoon event may not be available for regular dismissal.
Districts should record these requirements separately and test whether activity assignments overlap with scheduled service. The objective is to avoid assuming every owned bus is available for every purpose.
The Spare Buses and Driver Reality
Calculating the active fleet establishes how many vehicles must operate. It does not establish how many buses a district should own.
Additional vehicles provide coverage when buses are undergoing inspections, receiving repairs, or experiencing mechanical failures.
The appropriate reserve depends on actual downtime and service expectations. The dedicated resource on how many spare vehicles a fleet should keep explains that separate calculation.
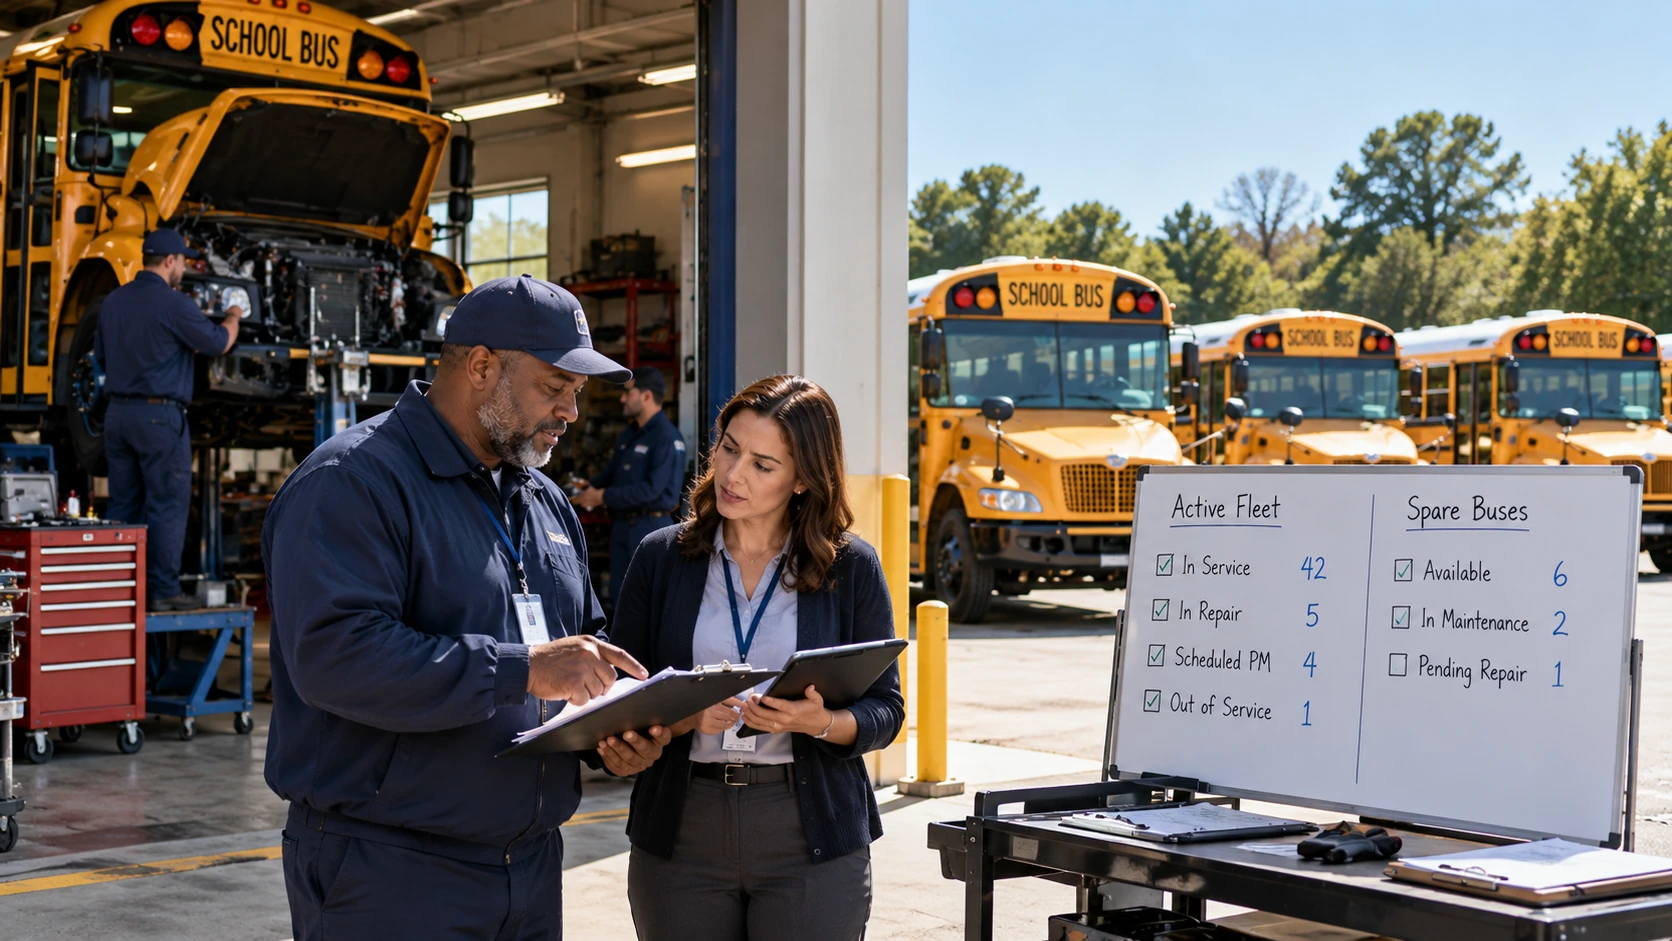
A district also needs to distinguish a mechanically available bus from one that is ready for student transportation. Outstanding safety defects, overdue inspections, and required maintenance can prevent a vehicle from entering service.
Reliable fleet maintenance work order software helps document repairs, outstanding work, and return to service decisions.
Driver staffing creates another capacity limit. The Associated Press and NORC Center for Public Affairs Research reported in its 2025 school transportation study that 81% of surveyed school administrators considered bus driver shortages a problem.
For wage context, the U.S. Bureau of Labor Statistics reported a median annual wage of $47,920 for school bus drivers in May 2025.
Even when the physical fleet is sufficient, a district cannot operate more simultaneous routes than its available qualified drivers can cover.
Organized fleet driver management helps transportation departments maintain driver records and coordinate responsibilities, although it does not replace driver recruitment or route scheduling.
Keeping Your Fleet the Right Size Over Time
School bus fleet sizing is not a calculation districts should complete once and leave unchanged.
Enrollment shifts, attendance boundary changes, new housing developments, and school closures can alter transportation demand. A district might need more buses in one area while another area has unused capacity.
Regular fleet rightsizing reviews help transportation directors decide whether to retain, replace, reassign, or acquire vehicles based on actual service needs.
Electric school buses add another planning consideration. According to the World Resources Institute's 2026 electric school bus adoption research, more than 8,500 electric school buses were operating nationally as of June 2026.
Electric buses do not automatically require a larger fleet. Districts must test route mileage, climate, charging availability, turnaround times, and battery range before deciding whether the existing vehicles can complete the same schedules.
Transportation departments should also review their route requirements before each school year and compare planned assignments with actual operations. A fleet reports dashboard helps consolidate the maintenance, mileage, and utilization information needed for those reviews.
AUTOsist supports this process by centralizing vehicle usage, service history, maintenance activity, and fleet reporting. Districts can combine those records with their transportation scheduling data to support budget requests and determine whether their current fleet still matches demand.
The right school bus fleet size is ultimately the smallest reliable combination of active vehicles that can complete every required route safely and on time, supported by appropriate spare capacity and qualified drivers.
Frequently Asked Questions
-
How many students should a district plan for per school bus?
Use the bus's safe seating capacity for the students being transported. High school students generally require more seating space than elementary students, while accessible routes may carry fewer passengers. -
Can one school bus operate three different routes each morning?
Yes, if staggered bell times provide enough time for pickups, unloading, and travel between routes. Verify actual route durations before assigning three runs. -
How many spare buses should a school district maintain?
Maintain enough road ready spare buses to cover expected breakdowns, scheduled maintenance, and unexpected vehicle shortages. Base the reserve on actual downtime and operational needs. -
What if a district has enough buses but not enough drivers?
Driver availability limits how many routes a district can operate. Consider adjusting schedules, combining feasible routes, or recruiting qualified substitute drivers. -
Does switching to electric school buses increase fleet size?
Not necessarily. Additional buses may be needed if battery range, charging time, or route schedules prevent existing vehicles from completing their assigned trips.