Miya Bholat
Jul 21, 2026
Why Fleet Productivity Looks Different by Location

Fleet productivity looks different by location because traffic, climate, terrain, route length, service access, and local rules change how much useful work a vehicle and driver can complete. Effective fleet performance management compares each depot against conditions it can reasonably control instead of forcing every location to meet one national target.
The solution is to define productivity consistently, then adjust targets, maintenance intervals, and downtime expectations by operating environment. A city branch may need tighter brake and tire controls, while a rural branch may need stronger roadside response planning and more tolerance for long service distances.
Key Takeaways
- Location changes the meaning of productive work. High stop counts may matter in cities, while route completion and uptime may matter more in rural operations.
- Urban fleets gain service access but absorb traffic related wear. Congestion, parking, frequent braking, and tolls reduce effective working hours.
- Rural breakdowns create longer disruptions. Towing distance, limited technician access, and slower parts delivery increase recovery time.
- Climate should change maintenance timing. Cold, heat, humidity, and road salt create different failure patterns.
- Terrain affects vehicle selection and component life. Mountain routes, gravel roads, coastal air, and highway mileage stress different systems.
- Reporting definitions should stay consistent even when targets differ. Every branch should calculate the same KPIs, but location targets should reflect local conditions.
The Same Productivity Metric, Wildly Different Results
Imagine two 40 vehicle fleets with the same dispatch process and daily job target. One operates in a dense metro area with nearby repair shops. The other covers remote counties where one failed tire can require hours before help arrives. Their management quality may be equal, yet their results will differ.
A useful calculation is:
Productivity score = Productive hours ÷ Paid shift hours × 100
Geotab identifies 70 percent as an ideal technician productivity score, but that is a reference point rather than a universal fleet target. A depot with predictable shop access should not be benchmarked exactly like one facing extreme weather or long roadside response times.
The main location variables are terrain, climate, urban or rural conditions, and regional compliance. Ignoring them can make environmental delays look like driver or management failures.
Urban Fleets: High Activity, High Attrition
Urban fleets often complete more stops within a smaller area, yet frequent braking, idling, curb access problems, and repeated acceleration create intense wear. These pressures are especially relevant for last mile delivery fleet operations, where route density does not always produce efficient working time.
The main urban productivity pressures include:
- Brake and tire wear: Frequent stops, potholes, sharp turns, and curb contact shorten component life.
- Congestion delays: A route may cover few miles but still consume most of a shift.
- Parking and unloading limits: Drivers lose time finding legal access or waiting for loading zones.
- Compliance rerouting: Weight restrictions, emission rules, and access windows can force longer routes.
- Fines and tolls: Missed local requirements add cost even when the job is completed.
Cities also offer an advantage. Repair shops, mobile service providers, and parts suppliers are usually closer, which can shorten downtime.
What Urban Compliance Is Costing Fleets Right Now
New York City began congestion tolling on January 5, 2025. Current peak rates are $14.40 for small trucks and $21.60 for large trucks entering Manhattan's Congestion Relief Zone, so dispatch timing now affects both cost and productivity.
California rules also require careful review. Advanced Clean Fleets remains relevant for state and local government fleets, while 2025 amendments added flexibility and moved toward repealing requirements for private and drayage fleets. Separate Advanced Clean Trucks sales rules have been adopted by states including New York, New Jersey, Oregon, and Washington. Operators should verify the rule, owner type, model year, and jurisdiction before setting procurement or route policy.
Hours of service and other DOT penalties vary and change over time. Compliance should therefore be built into dispatch rather than handled after a route is assigned.
Rural Fleets: Fewer Stops, Bigger Breakdowns
Rural fleets complete fewer stops but usually cover more miles with fewer recovery options. A breakdown may require a long tow, an overnight parts shipment, or a technician from another county. For trucking and logistics fleet operations, recovery time may matter more than stop count.
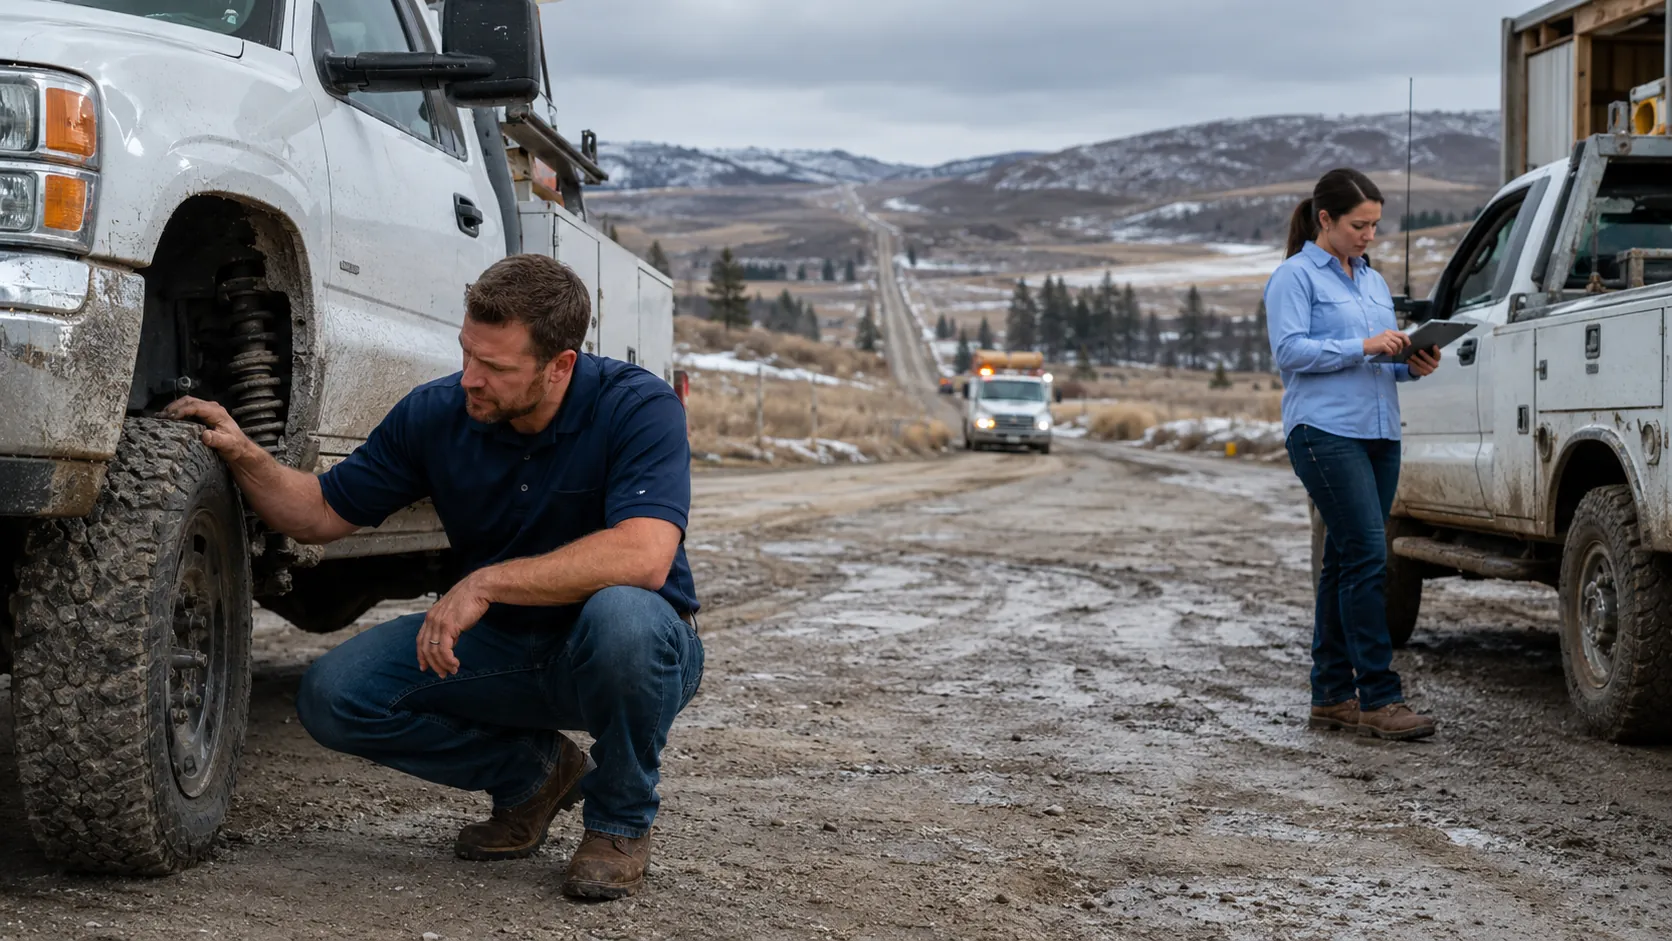
Rural locations face these risks:
- Remote response: Distance to towing, repair, and replacement vehicles delays diagnosis.
- Rough roads: Gravel and uneven surfaces accelerate tire, suspension, steering, and undercarriage wear.
- Limited specialists: Diesel, hydraulic, refrigeration, or electrical technicians may not be nearby.
- Long parts lead times: Depots may need stronger parts inventory management for common failures.
- Compressed driver hours: Longer routes leave less flexibility when delays occur.
The True Cost of Rural Downtime
A widely cited benchmark estimates 8.7 unplanned downtime days per vehicle each year and roughly $448 to $760 in daily cost. At about $79 per hour, a 50 vehicle fleet with 8.7 eight hour downtime days per vehicle faces estimated exposure of about $275,000 before location specific towing or missed service penalties. Actual loss varies by fleet type and revenue model.
A roadside event can also reach roughly $3,000 to $9,000 after towing, repairs, driver expenses, and lost revenue. Planned service and depot stocking are usually cheaper than a remote failure.
Climate Zones Change Everything About Vehicle Wear
The United States Department of Energy cold weather fuel economy data reports that conventional gasoline vehicle fuel economy in city driving is about 15 percent lower at 20°F than at 77°F. Hybrid fuel economy can fall around 30 percent, while electric vehicle efficiency can decline nearly 40 percent in controlled testing.

Cold increases battery demand, thickens fluids, lowers tire pressure, and makes seals or hoses brittle. Heat accelerates battery aging, stresses cooling systems, raises air conditioning load, and makes incorrect tire pressure more dangerous. Fleets should connect these patterns to seasonal fleet performance planning instead of reacting after failures rise.
| Climate | Priority checks | Productivity risk |
|---|---|---|
| Cold | Antifreeze, battery, tire pressure, belts, hoses, seals | Slow starts, lower fuel economy, route delays |
| Hot | Cooling system, air conditioning, battery cycles, tires, fluids | Overheating, tire failure, unscheduled stops |
| Snow and salt | Brakes, frame, undercarriage, wiring, washing | Corrosion, seized components, longer repairs |
| Humid or coastal | Electrical connections, body, filters, seals | Intermittent faults and reduced component life |
Why One Maintenance Schedule for All Locations Fails
A schedule designed for San Diego may under protect vehicles in Minnesota. The reverse can schedule unnecessary work in a mild climate.
Location based preventive maintenance schedules should combine mileage, engine hours, calendar time, climate exposure, and inspection findings. A digital vehicle inspection process can capture cold start issues, corrosion, tire changes, and cooling problems before they become roadside failures.
Location aware maintenance workflow
Terrain and Road Conditions: The Hidden Wear Variable
Terrain creates wear patterns that mileage alone cannot explain. A highway vehicle may accumulate miles quickly on smooth roads, while a low mileage construction vehicle absorbs severe suspension and undercarriage stress. This is why construction fleet management should track road surface and duty cycle beside odometer readings.
| Terrain type | Components under stress | Planning response |
|---|---|---|
| Highway | Engine, fluids, tires through accumulated mileage | Mileage based service and tire rotation |
| Urban | Brakes, tires, steering, cooling | Shorter inspections and idle tracking |
| Rural gravel | Suspension, tires, steering, undercarriage | Condition checks and critical spares |
| Mountainous | Brakes, transmission, cooling, fuel system | Brake inspections and suitability review |
| Coastal | Frame, body, wiring, fasteners | Corrosion control and wash routines |
Urban fleets may benefit from regenerative braking and predictable charging. Rural or mountain fleets may need greater range, stronger suspension, and more reserve capacity for detours or weather.
How to Set Location Aware Productivity Benchmarks for Your Fleet
The goal is to separate controllable process problems from unavoidable location pressure. Use this method:
- Audit every location. Record climate, terrain, road surfaces, route density, service distance, parts lead time, and applicable rules.
- Set intervals by environment. Increase battery checks in cold regions, brake checks on mountain routes, and corrosion checks near salt exposure.
- Track downtime by location. Compare roadside events, repair duration, parts delays, and repeat failures by depot.
- Create peer groups. Compare similar branches before ranking them against the entire fleet.
- Review targets with operating data. Use fleet data metrics to separate utilization, productivity, route completion, idle time, and downtime.
Every location review should answer:
- What temperatures and weather extremes affect this depot?
- Which road surfaces and terrain dominate routes?
- Which state, city, and industry rules affect vehicle access?
- How far is the nearest qualified service provider?
- What is the lead time for critical parts?
AUTOsist can support this process through custom service triggers and a fleet reports dashboard that compares maintenance, usage, and downtime across branches.
Standardizing Reporting Across Multiple Locations
KPI definitions should remain consistent even when targets change. Every branch should calculate downtime, utilization, productive hours, maintenance compliance, and cost per mile with the same rules. A standardized multi location fleet reporting process keeps comparisons credible while allowing realistic local targets.
Pointers for Multi Location Fleet Managers
Location directly affects maintenance demand, route capacity, compliance cost, vehicle selection, and recovery time. Fleets that ignore it may punish a rural branch for long repair distances or reward an urban branch for high stop counts despite excessive wear.
As congestion pricing expands, emission requirements evolve, and weather becomes less predictable, location based planning will matter more. Strong programs use common reporting definitions, local targets, and maintenance rules that reflect the conditions each vehicle faces.
Frequently Asked Questions
-
Why does fleet productivity vary between urban and rural areas?
Urban fleets complete more stops but lose time to congestion, parking, and frequent braking. Rural fleets cover longer distances and face slower repair response, so route completion and uptime may be better measures than stop count. -
How does cold weather affect fleet vehicle maintenance costs?
Cold weather lowers fuel economy, reduces battery performance, changes tire pressure, and increases cold start stress. It can also make hoses, belts, and seals more vulnerable. -
What maintenance changes should a fleet manager make for different climate zones?
Cold regions need stronger battery, fluid, tire, seal, and corrosion checks. Hot regions need tighter cooling system, air conditioning, battery, tire, and fluid monitoring. -
How do low emission zones affect fleet productivity in cities?
They can restrict access, create toll or compliance costs, and force route changes. Fleets should map regulated zones before dispatch and confirm assigned vehicles meet current requirements. -
What is a good fleet productivity score, and does it change by location?
A 70 percent technician productivity score is a useful reference, but not a universal fleet target. Keep the calculation consistent, then adjust targets for climate, terrain, route density, service access, and local compliance.