Miya Bholat
Aug 21, 2026
Why HVAC Fleets Fall Behind During Peak Season?
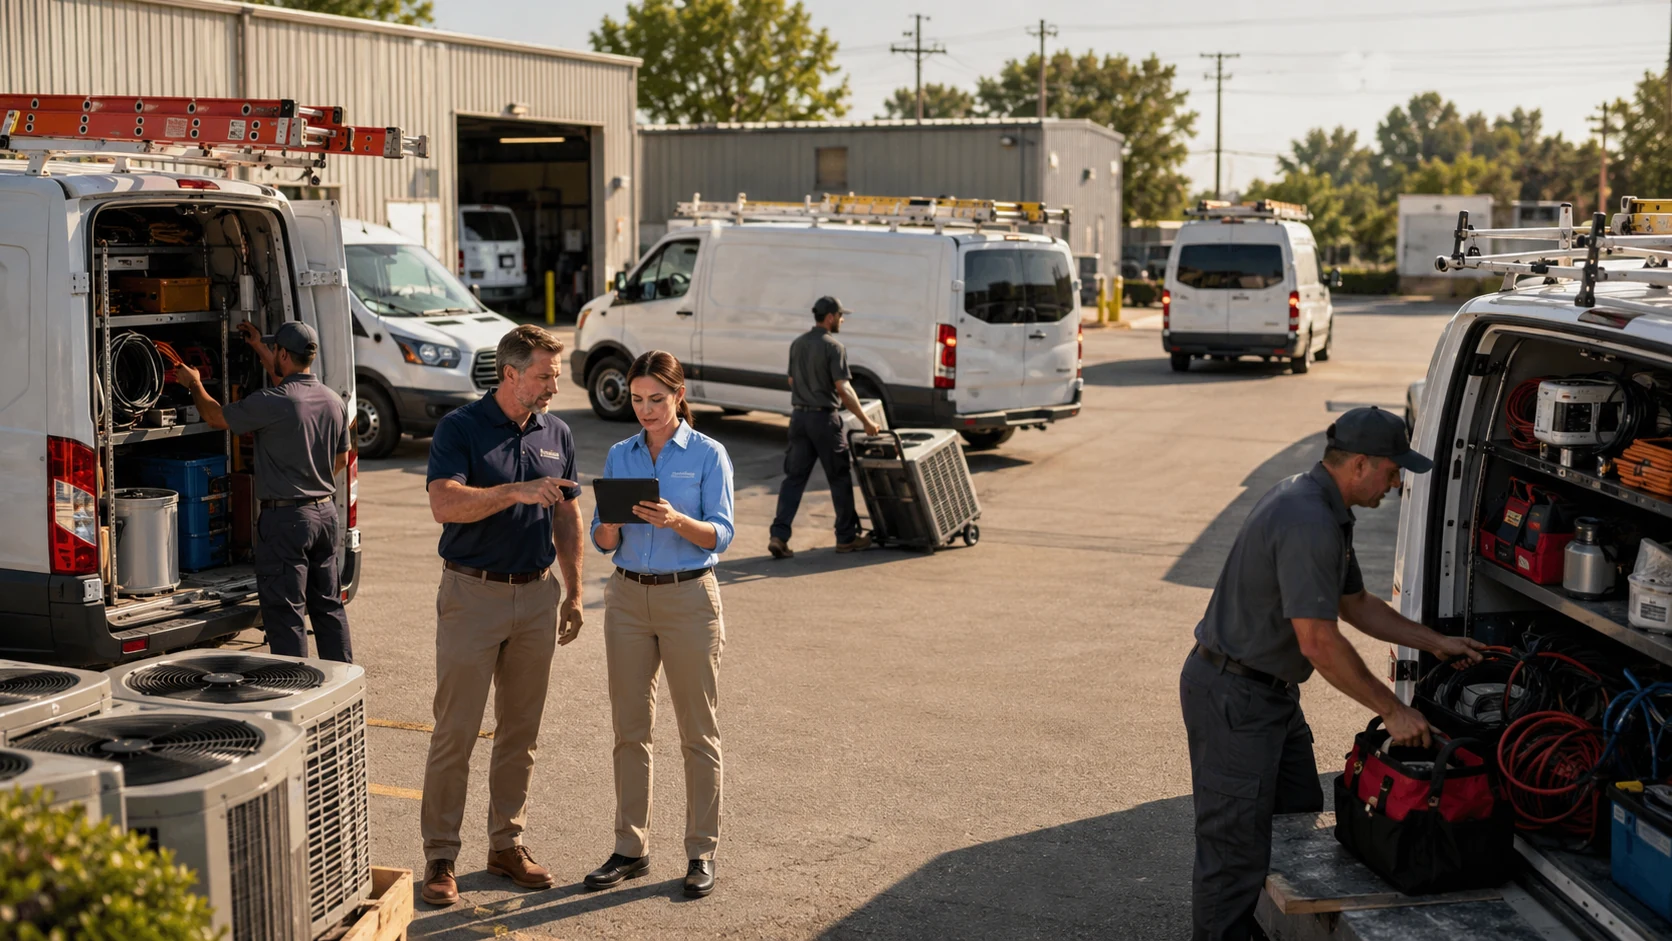
HVAC fleets fall behind during peak season when service demand rises faster than available technicians, reliable vehicles, dispatch capacity, and stocked equipment. The result is missed appointment windows, backed up dispatch queues, technicians waiting for vans, and vehicles leaving rotation when every available unit is needed. Effective HVAC fleet management addresses these connected causes before call volume spikes.
The problem is rarely one major failure. Deferred maintenance, aging vehicles, incomplete van inventories, urgent calls, and labor constraints compound until the schedule can no longer absorb another delay. The broader impact of seasonal demand on fleet performance follows a similar pattern across industries, but HVAC fleets face unique pressure because customer comfort emergencies often cannot wait.
Key Takeaways
- Peak season exposes problems created during slower months. Deferred service, postponed hiring, and incomplete van restocking become operational constraints when demand rises.
- One unavailable vehicle can disrupt several jobs. A breakdown affects the assigned technician, dispatch plan, customer windows, and every call moved to another route.
- A running van is not automatically a productive van. Missing tools and parts can cost billable hours even when the vehicle has no mechanical problem.
- Technician and vehicle shortages compound each other. Adding technicians does not restore capacity if there are not enough reliable, properly equipped vans.
- Readiness requires a sequence, not a final inspection. Fleets need to review vehicle condition, maintenance, inventory, dispatch coverage, and labor capacity before the surge.
- Consistent fleet data makes seasonal pressure more predictable. Service history, inspections, work orders, and downtime records reveal where capacity is most likely to fail.
What "Falling Behind" Actually Looks Like in Peak Season
Falling behind begins before the dispatch board looks overwhelmed. A technician arrives late because the assigned van needed a battery replacement. Another technician waits for a replacement vehicle. An urgent no cooling call interrupts a planned route. By midday, several appointment windows have shifted, and lower priority jobs move to tomorrow.
Fleet managers should watch for a repeating set of symptoms:
- Technicians waiting for available vehicles
- First appointments starting late
- Jobs reassigned after dispatch
- Repeat failures involving the same vans
- Calls postponed because of vehicle or inventory gaps
- Overtime increasing without a matching rise in completed jobs
These are not separate inconveniences. They are evidence that available fleet capacity has fallen below scheduled service demand. The purpose of root cause analysis is to identify which constraint started the cascade.
Why HVAC Peak Season Hits Fleets Harder Than Other Seasonal Businesses
HVAC demand is driven by uncomfortable and sometimes unsafe indoor temperatures. Customers with failed cooling or heating systems expect rapid service, which gives dispatchers less freedom to move urgent calls into a quieter part of the week.
How Peak Timing Varies by Region
Cooling demand starts earlier and can continue longer in warmer climates. Colder regions may experience their greatest surge during heating season. A business operating across several regions may therefore manage two major capacity windows instead of one.
National and multiregional fleets must prepare vehicles according to local weather patterns rather than using one companywide readiness date. Regional service history can reveal when call volume, mileage, idling, and vehicle failures usually begin rising in each market.
Why the Slow Season Sets Up the Peak Season Failure
The slow season may appear to offer flexibility, but postponed maintenance creates hidden risk. Vehicles continue aging while preventive work, replacements, van restocking, and hiring decisions wait.
This is also when teams may lose focus on tasks without an immediate deadline. Understanding why fleet priorities get lost during busy operational weeks can help managers establish ownership and completion dates before seasonal preparation begins.
Root Cause 1: Deferred Maintenance That Catches Up at the Worst Time
Skipped preventive service does not disappear. It increases the chance that batteries, cooling systems, tires, belts, brakes, and other wear items will fail when vehicles are traveling more miles and idling longer.
A 2026 fleet benchmark report found that vehicles more than 10 years old represented only 12.1 percent of miles driven but 33.5 percent of total service spending. Their service cost averaged $1.10 per mile, compared with $0.20 for vehicles from zero to five years old. The age of a vehicle does not automatically make it unreliable, but the difference shows why managers must assess older units before assigning them to full peak season schedules.
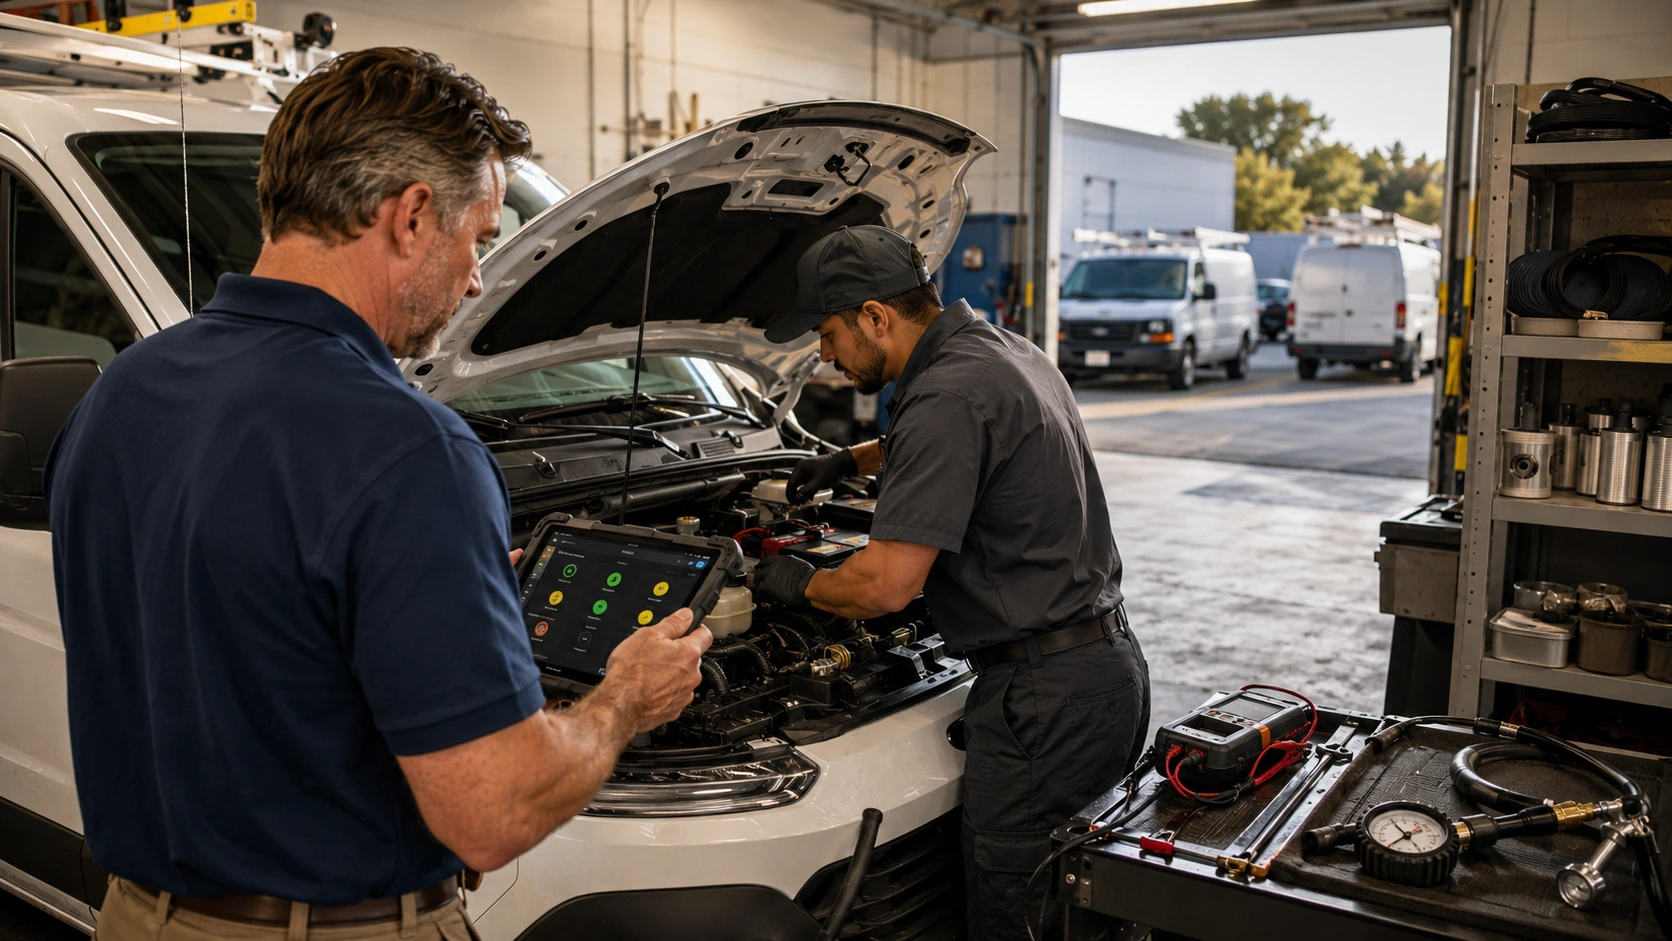
The warning signs often appear in existing records. A review of why fleet vehicles age faster than expected can help separate unavoidable aging from wear caused by inconsistent service and operating practices.
Managers can reduce this risk by placing recurring services on fleet preventive maintenance schedules based on time, mileage, or operating use. Completing overdue work before the first surge protects capacity when every van matters.
Research on fleet maintenance performance also estimates that unplanned downtime costs between $448 and $760 per vehicle each day and that roughly 78 percent of breakdowns are preventable. Even at the lower estimate, two vans unavailable for three days create $2,688 in downtime cost before counting delayed jobs or lost customers.
Root Cause 2: Dispatch and Scheduling Breakdowns Under Pressure
Urgent no cooling and no heating calls interrupt planned routes. Dispatch may send the closest technician, but that decision can delay the technician's remaining appointments and require several later reassignments.
A late start has the same cascading effect. A 2026 fleet benchmark report found a median work order start time of 31 minutes but an average of 6.7 days. Only 9.7 percent of fleets reported truly consistent on time maintenance, while 44.3 percent said they performed reasonably well. The large difference between the median and average indicates that some work orders remain untouched long enough to create serious availability problems.
A structured fleet maintenance work order process gives managers clearer ownership, priority, and repair status. Dispatchers can then see whether a vehicle will return quickly or whether the day's route needs to be rebuilt before customers are affected.
Root Cause 3: Parts, Tools, and Upfit Gaps That Slow Technicians Down
A vehicle can be mechanically sound and still fail operationally. When technicians cannot find a required tool, commonly used component, refrigerant accessory, or safety item, they lose time searching, returning to the shop, or purchasing supplies.
Fleet and field service productivity studies report that inefficient vehicle upfits and disorganized tool or parts storage can increase job completion time by 10 to 20 percent. For a technician scheduled for eight hours of field work, that could consume 48 to 96 minutes of productive capacity.
A parts inventory management process can connect stock levels with actual usage. Managers should define standard van inventory by job type, establish minimum quantities for high use items, and restock vans before the first appointment rather than during the route.
Root Cause 4: Technician and Vehicle Capacity Mismatches
A fleet may have enough vans on paper but too few reliable, properly equipped units for the technicians scheduled. The opposite can also occur when vehicles are available but open technician positions prevent them from producing revenue.
When a Labor Shortage Meets Vehicle Downtime
The United States Bureau of Labor Statistics projects HVAC and refrigeration mechanic and installer employment to grow 8 percent from 2024 to 2034. It also projects about 40,100 openings each year, with many resulting from retirements, occupational transfers, and other workforce exits.
HVAC365 reported in 2026 that labor shortages were worsening before peak cooling season, stretching technician availability as calls increased. When a business has fewer technicians and loses vehicles to downtime, the constraints multiply. Five available technicians with only four ready vans do not provide five technicians of capacity.
Building a Peak Season Readiness Plan
Fleet managers should complete preparation in an order that resolves the largest capacity risks first.
- Audit vehicle age and service history. Identify older vehicles, repeat repairs, open recalls, overdue services, and units with increasing cost per mile.
- Complete deferred preventive maintenance. Prioritize work that could remove a vehicle from service during peak demand.
- Stock high use and high failure items. Confirm required tools, common service parts, safety equipment, and standard van inventory.
- Confirm dispatch and backup vehicle coverage. Decide which reserve vehicles are ready and how routes will be reassigned if a primary van fails.
- Review technician to vehicle ratios. Compare scheduled technicians with ready, equipped vehicles for each branch and shift.
- Set escalation thresholds. Define when recurring defects, repair delays, inventory shortages, or missed jobs require management action.
Pre Peak Vehicle Checklist
The checklist should verify mechanical readiness and field productivity, not just whether a van can start.
| Check Area | What to Verify | Why It Matters During Peak Season |
|---|---|---|
| Cooling system | Fluid condition, hoses, belts, leaks, and operating temperature | Long routes and extended idling increase heat exposure |
| Battery | Charge, age, terminals, and replacement history | Weak batteries can cause sudden morning route failures |
| Tires | Pressure, tread, damage, and spare condition | Higher mileage accelerates wear and raises roadside risk |
| Tools and parts | Required tools, common components, and minimum stock levels | Missing supplies delay jobs even when the van is available |
| Inspection compliance | Completed inspections, unresolved defects, and required records | Open defects can make a vehicle unsafe or unavailable |
| Service status | Due services, repeat repairs, and open work orders | Unfinished maintenance can become peak season downtime |
Using digital vehicle inspections helps technicians document defects consistently and gives managers time to act before a minor issue removes a van from rotation.
In Season Monitoring Priorities
Once demand rises, fleet managers should review a focused set of indicators:
- Repeat breakdowns by vehicle and component
- Jobs delayed or lost because of vehicle availability
- Technician downtime caused by vehicle or inventory issues
- Preventive services approaching their due dates
- Work orders waiting to begin
- Backup vehicle use by branch
The goal is to detect a capacity trend before it becomes a full dispatch backlog. A recurring battery issue affecting three vans, for example, should trigger a fleetwide battery review rather than three isolated replacements.
How Fleet Data Turns a Reactive Peak Season Into a Predictable One
Reliable data shows which vehicles are becoming expensive, which defects repeat, how long repairs remain open, and how often vehicle delays affect technicians. Without those records, managers make peak season decisions from memory and react only after capacity has already declined.

AUTOsist can support this process by connecting preventive maintenance scheduling, inspections, work orders, parts records, and complete vehicle service history tracking around each unit. The value comes from closing specific information gaps, not simply collecting more data.
Managers can use a fleet reports dashboard to compare downtime, service cost, repair frequency, and overdue work across branches. Reviewing those patterns before and during peak season turns breakdowns, inventory shortages, and route delays into measurable risks that teams can address earlier.
Frequently Asked Questions
-
Why do HVAC fleets fall behind during peak season?
HVAC fleets fall behind when demand rises faster than vehicle, technician, dispatch, and inventory capacity. Deferred maintenance and urgent calls increase the pressure. Research also suggests that roughly 78 percent of fleet breakdowns are preventable, which means many peak season delays begin with risks that could have been addressed earlier. -
How early should an HVAC fleet prepare for peak season?
Preparation should begin several weeks before the expected regional cooling or heating surge. Fleet managers need enough time to complete overdue maintenance, inspect high use vehicles, stock common parts, prepare backup vans, and compare technician schedules with actual vehicle availability. -
Which HVAC service vehicles should be inspected first?
Start with older vehicles, units with repeated repairs, vans with overdue service, and vehicles assigned to the busiest routes. Fleet benchmark research found that vehicles over 10 years old represented 12.1 percent of miles driven but 33.5 percent of service spending, showing why older units need closer review. -
How does vehicle downtime affect HVAC technician capacity?
Vehicle downtime can leave a technician unable to reach customers even when that technician is available to work. With about 40,100 HVAC job openings projected each year by the United States Bureau of Labor Statistics, businesses cannot afford to lose limited technician capacity because a service van is unavailable or improperly stocked. -
What fleet metrics should HVAC companies track during peak season?
HVAC companies should track repeat breakdowns, overdue maintenance, work order start time, technician downtime, jobs delayed by vehicle issues, backup van use, and parts shortages. Fleet benchmark research reports a median work order start time of 31 minutes but an average of 6.7 days, showing how a smaller group of severely delayed repairs can create major availability problems.