Miya Bholat
Jan 26, 2026
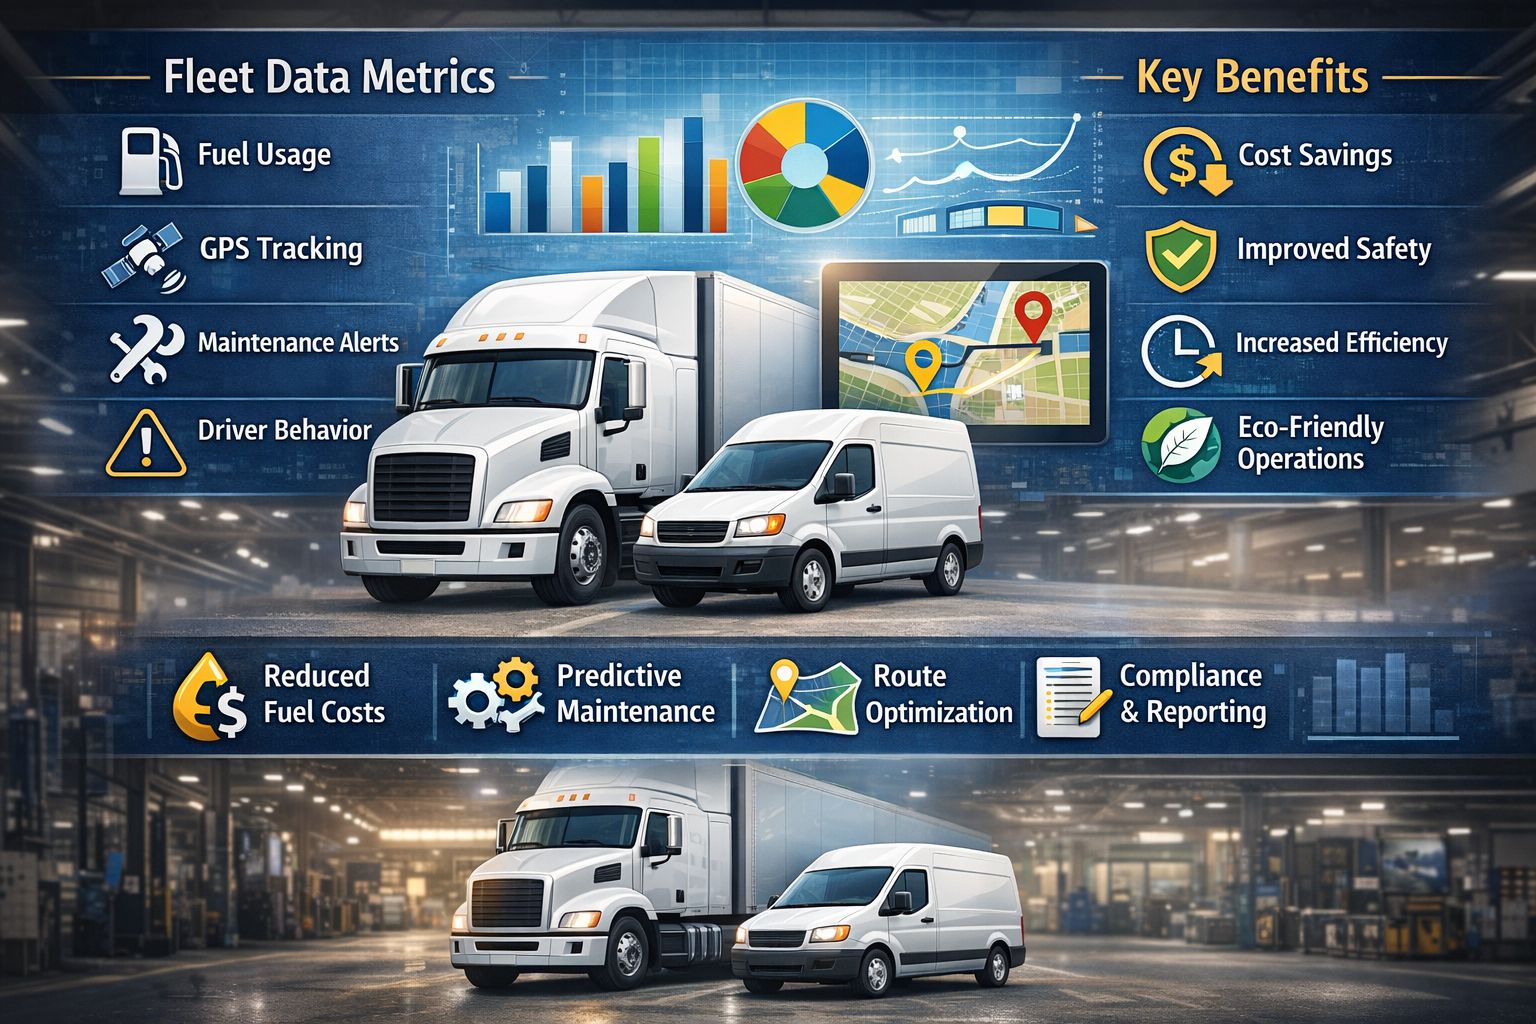
Fleet Data Metrics and Benefits for Smarter Fleet Decisions
Key Takeaways: Making Fleet Data Work for Your Operation
- Fleet data replaces guesswork with control. Metrics give managers visibility into cost, performance, and risk drivers.
- The right metrics matter more than more metrics. Focus on KPIs that directly impact uptime, safety, and spend.
- Preventive insights save real money. Data-driven maintenance reduces breakdowns and extends vehicle life.
- Consistency turns data into decisions. Regular reporting routines ensure insights lead to action.
- Centralized systems simplify complexity. Unified platforms make fleet data easier to track, analyze, and act on.
Why Fleet Data Metrics Matter More Than Ever
Fleet management has shifted dramatically over the last decade. What once relied on experience, intuition, and “we’ve always done it this way” thinking is now driven by measurable performance data. Rising operating costs, tighter margins, and increased regulatory pressure have made gut-feel decisions too risky for modern fleets. In 2025, fleet managers are expected to justify decisions with numbers, not assumptions.
Fuel prices remain volatile, labor costs continue to rise, and vehicle replacement prices are higher than ever. These pressures force fleet managers to extract more value from every asset already on the road. Fleet data metrics provide visibility into where money is being spent, where inefficiencies hide, and which vehicles or behaviors drive costs upward. Without metrics, problems surface only after budgets are blown or vehicles fail.
Regulatory oversight also plays a role. Safety compliance, inspections, and documentation requirements demand accurate records and consistent reporting. Data-driven fleets can demonstrate compliance quickly, respond to audits with confidence, and reduce exposure to fines or out-of-service events. Fleets operating without reliable data often scramble to piece together information when issues arise.
Most importantly, data metrics give fleet managers control. Instead of reacting to breakdowns, complaints, or budget surprises, managers can identify trends early and take corrective action. Fleets that track and act on the right metrics consistently outperform those that don’t—both financially and operationally.
Essential Fleet Metrics Every Manager Should Track
Fleet data metrics fall into clear categories that reveal different aspects of fleet health. Tracking numbers alone is not enough; understanding what those numbers signal is what allows managers to act. Each category below highlights where issues develop and how they connect to real-world outcomes like uptime, cost control, and safety.
Vehicle Performance and Utilization Metrics
Performance and utilization metrics show how effectively vehicles support operations. These metrics reveal whether assets are being used too much, too little, or inefficiently.
Common metrics in this category include:
- Vehicle uptime: Percentage of time vehicles are available for service
- Utilization rate: How often vehicles are actively used versus parked
- Miles per vehicle: Average distance driven over a set period
- Idle time: Engine-on time without movement
For most fleets, “good” uptime exceeds 95%. If uptime drops to 90% in a 50-vehicle fleet, that equates to five vehicles unavailable on any given day. Excessive idle time often signals driver behavior issues or routing inefficiencies, while low utilization can indicate poor fleet sizing or dispatch practices.
Maintenance and Repair Metrics
Maintenance metrics expose the true cost of keeping vehicles on the road and whether maintenance strategies are working. These numbers help managers shift from reactive fixes to planned service.
Key maintenance metrics include:
- Cost per mile (CPM): Total maintenance spend divided by miles driven
- Preventive vs. reactive maintenance ratio: Planned service versus breakdown repairs
- Mean time between failures (MTBF): Average operating time between breakdowns
- Maintenance turnaround time: How long vehicles stay out of service
For example, if your fleet’s maintenance cost per mile is $0.22 while similar fleets operate at $0.15, the gap becomes significant. A 100-vehicle fleet driving 20,000 miles per vehicle annually would overspend by $140,000 per year at that difference. Tracking these metrics allows managers to correct issues before costs escalate further.
Fuel and Efficiency Metrics
Fuel is one of the largest and most controllable fleet expenses. Fuel metrics reveal inefficiencies tied to vehicle condition, routes, and driving behavior.
Important fuel-related metrics include:
- Miles per gallon (MPG): Fuel efficiency by vehicle or class
- Fuel cost per mile: Fuel spend divided by miles driven
- Fuel consumption trends: Changes over time by vehicle or driver
- Idle fuel usage: Fuel burned during excessive idling
A 10-vehicle fleet spending $4,000 per month on fuel could save $400 monthly by improving MPG by just 10%. Poor MPG often links back to maintenance issues such as underinflated tires, overdue engine service, or excessive idling—making fuel data closely tied to maintenance metrics.
Safety and Compliance Metrics
Safety and compliance metrics protect drivers, vehicles, and the business itself. These metrics reduce risk while supporting insurance and regulatory requirements.
Common safety metrics include:
- Incident rates: Accidents per mile or per vehicle
- Inspection completion rates: On-time DVIRs and inspections
- Compliance violations: DOT or regulatory infractions
- Driver safety scores: Composite behavior indicators
Fleets with consistent inspection completion rates above 98% experience fewer roadside violations and lower accident rates. Digital inspection data, such as from a Digital Vehicle Inspection App, helps ensure issues are identified before they become safety events.
The Real-World Benefits of Tracking Fleet Data
Tracking fleet data delivers measurable, practical benefits that directly impact budgets, safety records, and long-term planning. These benefits extend beyond reporting—they drive better decisions across the entire operation.
Cost Reduction and Budget Optimization
Fleet data highlights waste that often goes unnoticed. By reviewing cost-per-mile, idle time, and repair frequency, managers can target the biggest cost drivers.
For example, if a 50-vehicle fleet averages $1,200 per vehicle annually in unexpected repairs, improving preventive maintenance could reduce those costs by 20%. That results in $12,000 in annual savings. Data also supports more accurate budgeting by replacing estimates with historical trends.
Extended Vehicle Lifespan
Predictive maintenance relies on trends rather than breakdowns. When fleets monitor MTBF and service intervals, they can address wear issues before failures occur.
Vehicles maintained proactively often remain in service one to two years longer than poorly maintained assets. Extending vehicle life by just one year in a 25-vehicle fleet can delay hundreds of thousands of dollars in replacement costs while preserving resale value.
Improved Safety and Risk Management
Fleet data uncovers risky patterns early. Rising incident rates, missed inspections, or repeated driver violations often appear in the data before serious accidents occur.
Improved safety metrics can lower insurance premiums over time and reduce liability exposure. Insurers increasingly favor fleets that can demonstrate documented safety practices and consistent inspection records backed by data.
Better Decision-Making for Fleet Growth
Historical data supports smarter expansion decisions. Utilization trends reveal whether additional vehicles are truly needed or if existing assets can handle demand.
For instance, if utilization averages only 65% across a fleet, adding vehicles may be unnecessary. Instead, reallocating assets or improving scheduling may meet growth demands without capital investment. Replacement timing also improves when maintenance and fuel trends signal declining efficiency.
Common Challenges in Fleet Data Management
Despite the benefits, many fleet managers struggle to implement effective data tracking. One major challenge is data silos. Fuel data, maintenance records, inspections, and GPS data often live in separate systems, making analysis time-consuming and inconsistent.
Manual tracking creates additional limitations. Spreadsheets and paper logs increase the risk of errors, missing entries, and outdated information. As fleets grow, manual systems simply cannot scale without consuming excessive administrative time.
Another common obstacle is analysis paralysis. Fleet managers may collect large volumes of data without clear priorities, leading to dashboards that overwhelm rather than inform. Without defined KPIs, valuable insights remain buried and unused.
Centralized platforms such as a Fleet Reports and Dashboard help overcome these challenges by consolidating data and presenting it in actionable formats.
How to Turn Fleet Data Into Actionable Insights
Collecting data is only the first step. Turning numbers into decisions requires structure, discipline, and consistent review habits.
Setting Benchmarks and KPIs
Effective fleets establish baselines before setting improvement targets. Benchmarks should reflect fleet size, vehicle type, and industry conditions rather than generic averages.
Common KPIs include cost per mile, uptime percentage, inspection completion rate, and fuel efficiency. Setting realistic targets—such as reducing idle time by 15% over six months—creates focus and accountability.
Creating Regular Reporting Routines
Reporting cadence matters as much as the data itself. Daily reviews catch urgent issues, weekly reports highlight trends, and monthly summaries support strategic planning.
A practical reporting structure includes:
- Daily: Missed inspections, breakdowns, urgent repairs
- Weekly: Fuel efficiency, idle time, maintenance backlog
- Monthly: Cost trends, utilization, safety metrics
Consistent routines ensure data drives action rather than becoming background noise.
Using Data to Predict and Prevent Problems
Predictive management relies on trend analysis rather than single data points. Rising maintenance turnaround time or declining MPG often signals underlying issues before failures occur.
Integrated systems, such as combining maintenance data with Fleet Fuel Management and Tracking Software or GPS integrations, help fleets identify patterns earlier and intervene proactively.
When fleet data metrics are tracked consistently and reviewed intentionally, they become one of the most powerful tools a fleet manager can use to improve performance today and plan confidently for the future.