Miya Bholat
Oct 13, 2026
Fleet Technician Wrench Time: What to Measure?

Fleet technician wrench time measures the percentage of a technician's working hours spent actively repairing, servicing, or troubleshooting vehicles. Tracking it shows fleet managers how much available labor becomes productive maintenance work and where time disappears into parts searches, approvals, travel, and administrative tasks. As part of fleet performance management, wrench time helps shops improve repair capacity, reduce avoidable delays, and make better use of existing technicians without compromising work quality.
Key Takeaways
- Wrench time measures actual repair activity. It separates hands on maintenance work from waiting, travel, paperwork, and other activities.
- The formula depends on consistent definitions. Calculate hands on repair hours divided by the same defined pool of working hours.
- Low wrench time does not automatically mean poor technicians. Missing parts, unclear assignments, and approval delays can reduce productive hours.
- Typical industry figures range from 25% to 35%. These practitioner benchmarks provide context but are not universal fleet shop standards.
- Small improvements create meaningful capacity. An eight technician shop can recover eight productive hours per day by improving wrench time by ten percentage points.
- Tracking delay categories matters more than one percentage. Understanding where nonproductive hours go helps managers identify useful improvements.
- Wrench time needs companion metrics. Repair duration, first time fixes, rework, and preventive maintenance compliance reveal whether additional activity creates better results.
What Fleet Technician Wrench Time Actually Measures (and What It Doesn't)
Wrench time represents the portion of a technician's working time spent directly performing maintenance or repair activities. In a fleet shop, that includes replacing components, completing inspections that require physical checks, diagnosing faults, and performing scheduled maintenance.
The distinction matters because technicians perform many necessary activities that do not directly change a vehicle's condition. A technician might spend an entire shift handling maintenance responsibilities while recording only three hours of wrench time.
For example, an eight hour working period might include:
- 3 hours completing repairs and maintenance.
- 1.5 hours retrieving parts and preparing tools.
- 1 hour waiting for repair authorization.
- 1 hour moving between locations and assignments.
- 1.5 hours completing documentation and other required activities.
Only the three hours of direct maintenance count toward a strict wrench time calculation. With all eight hours included in the denominator, the rate is 37.5%.
The remaining time is not necessarily wasted. Some activities support safety, coordination, and accurate records. Managers should distinguish necessary support work from avoidable delays.
Wrench Time vs Utilization vs Efficiency
These metrics answer different operational questions. Measuring them separately prevents managers from confusing technician workload with productive repair output.
| Metric | What It Measures | Example |
|---|---|---|
| Wrench Time | Direct maintenance hours as a share of working time | 3 of 8 hours spent repairing |
| Utilization | Available time assigned to work | 7 of 8 hours assigned |
| Efficiency | Estimated repair hours compared with actual repair hours | A 3 hour estimated job completed in 2.5 hours |
A technician can have high utilization but low wrench time if assigned jobs repeatedly stall because of missing parts.
Likewise, a technician can record strong efficiency on individual repairs while spending much of the day waiting for the next assignment.
The Wrench Time Formula and the Two Decisions That Change Your Number
The basic formula measures the portion of working time spent on direct maintenance tasks.
Wrench Time (%) = (Hands On Repair Hours ÷ Total Available Working Hours) × 100
Consider a fleet maintenance shop with eight technicians working ten hour shifts, five days per week.
Example: Eight technician fleet shop
| Metric | Current Wrench Time (31%) | Improved Wrench Time (41%) |
|---|---|---|
| Number of Technicians | 8 | 8 |
| Daily Labor Hours | 80 | 80 |
| Daily Repair Hours | 24.8 | 32.8 |
| Weekly Labor Hours | 400 | 400 |
| Weekly Productive Repair Hours | 124 | 164 |
| Additional Productive Hours Per Week | 0 | +40 |
| Additional Technician Equivalent | 0 | +1 |
Calculation: Improving wrench time from 31% to 41% adds 8 productive repair hours daily, or 40 hours weekly, equivalent to one additional 40 hour technician.
Note: This is an illustrative calculation based on 400 paid labor hours per week. Actual productivity gains depend on workload, repair complexity, and shop operations.
However, two measurement decisions can substantially change the reported percentage: which activities count as wrench time and which hours belong in the denominator.
Choosing Your Denominator
The denominator defines the time against which productive maintenance activity is measured.
Common approaches include:
- Paid hours: All compensated shift hours, including paid breaks and meetings.
- Available hours: Paid hours excluding explicitly defined unavailable periods, such as approved leave or designated breaks.
- Scheduled hours: The hours allocated to the technician's scheduled shift or maintenance work, according to the shop's stated definition.
Suppose technicians record 24 hands on repair hours across 80 paid hours, 72 available hours, and 60 hours allocated to scheduled maintenance.
| Denominator | Calculation | Wrench Time |
|---|---|---|
| Paid hours | 24 ÷ 80 × 100 | 30% |
| Available hours | 24 ÷ 72 × 100 | 33.3% |
| Scheduled maintenance hours | 24 ÷ 60 × 100 | 40% |
The same repair output produces three different percentages.
For consistent reporting, choose one denominator, document every exclusion, and apply the same definition each reporting period. Use paid working hours when comparing against published benchmarks that use that basis.
What to Log in a Fleet Shop: A Non-Wrench Time Taxonomy
Knowing that wrench time is 35% offers limited value unless managers understand the activities consuming the remaining hours.
Start by capturing direct repair work separately from delay and support categories. Fleet maintenance work order software can organize assignments and repair records, giving supervisors a consistent place to associate labor entries with individual jobs.
The following taxonomy helps standardize what technicians record.
| Counts as Wrench Time | Non-Wrench Time (Log the Category) |
|---|---|
| Replacing failed components | Retrieving or searching for parts |
| Performing hands on diagnostics | Waiting for diagnostic equipment or instructions |
| Completing brake or engine repairs | Traveling between bays or road calls |
| Performing physical PM inspections | Completing DVIR forms and administrative paperwork |
| Installing replacement parts | Waiting for repair approvals |
| Testing repaired systems | Searching for tools or equipment |
| Completing required repair adjustments | Breaks, meetings, and training |
Active troubleshooting counts when a technician performs diagnostic work directly on the vehicle. Waiting for diagnostic equipment, instructions, or authorization does not.
For practical reporting, supervisors should identify recurring delay categories rather than require excessive detail about every movement.
Parts availability deserves particular attention. When technicians repeatedly leave a bay to locate components, maintaining accurate fleet parts inventory records can reduce searches and help teams prepare required materials before repairs begin.

Track each category in minutes or hours, then calculate its share of total working time.
Delay Category Share (%) = (Category Hours ÷ Total Working Hours) × 100
This reveals whether the biggest opportunity involves parts preparation, scheduling, approvals, or documentation.
Wrench Time Benchmarks for Fleet Shops (Read Them Honestly)
Maintenance industry benchmarks provide useful reference points, but fleet shops should avoid treating any single percentage as a universal productivity standard.
Doc Palmer, author of Maintenance Planning and Scheduling Handbook, describes typical wrench time of 25% to 35%. Ricky Smith and R. Keith Mobley describe a wider range across maintenance organizations.
| Source | Reported Wrench Time | Interpretation |
|---|---|---|
| Doc Palmer | 25% to 35% | Typical maintenance workforce |
| Doc Palmer | Around 55% | Strong planning and scheduling performance |
| Smith and Mobley | 18% to 30% | Most organizations |
| Smith and Mobley | 55% to 65% | World class maintenance operations |
These figures come from maintenance industry practitioner literature, not fleet specific national surveys.
Palmer's analysis of maintenance wrench time emphasizes planning and scheduling effectiveness. Smith and Mobley's wrench time research summary describes the wider performance ranges.
SMRP Metric 5.6.1 provides a recognized wrench time measurement framework, including work sampling. Its detailed benchmark guidance is not freely accessible as a current public standard. No published ISO or EN standard establishes one universal world class wrench time percentage.
Different operations also face different demands. A shop handling routine delivery van maintenance cannot automatically compare its performance against technicians repairing specialized emergency equipment.
For example, a government fleet maintenance operation may handle multiple vehicle types, varying approval procedures, and emergency assignments.
The most meaningful benchmark is therefore your own consistently measured trend across comparable work, staffing, and operating conditions.
How to Measure Wrench Time Without a Stopwatch Study
Fleet managers do not need to monitor every technician continuously to establish a useful baseline.
Three approaches offer different levels of detail:
- Work sampling: Observe randomly selected activities throughout multiple shifts and classify each observation.
- Day In The Life Of (DILO): Follow a representative technician through a shift to understand work sequences and recurring delays.
- Work order time capture: Record activity start, pause, and completion times, with separate codes for active repairs and delays.
Work sampling estimates the proportion of time spent on activities. A DILO observation provides richer context but may not represent every technician or shift.
Continuous work order tracking supports ongoing measurement, provided staff consistently pause repair time during interruptions. A timer running while waiting for parts does not represent wrench time.
A Six Step Workflow to Establish Your Baseline
Use the following process to produce a repeatable measurement that supports operational decisions.
Supervisors should review unusual entries and discuss recurring obstacles with technicians before drawing conclusions.
Reliable measurement also depends on complete repair information. Accessible vehicle service history records can help technicians find previous repairs and component issues without repeatedly reconstructing a vehicle's maintenance background.
The Companion Metrics That Keep Wrench Time Honest
Increasing hands on repair time is useful only if maintenance quality, vehicle availability, and schedule performance remain acceptable.
Consider a technician whose wrench time rises from 35% to 50%. If repeated repairs also increase, the shop may be completing more work without solving underlying failures.
Managers should pair wrench time with these four measures.
| Companion Metric | What It Reveals |
|---|---|
| Mean Time to Repair (MTTR) | Average elapsed time needed to restore a vehicle |
| First Time Fix Rate | Percentage of repairs resolved without a repeat visit for the same issue |
| Comeback or Rework Rate | Share of completed repairs requiring corrective follow up |
| PM Compliance | Percentage of preventive maintenance completed within the defined schedule |
These measurements provide different views of shop performance.
MTTR reveals whether vehicles return to service sooner. First time fix rate and rework indicate repair quality. PM compliance shows whether technicians can complete planned maintenance rather than constantly respond to emergencies.
Consistent preventive maintenance scheduling also helps managers evaluate whether planned workload and technician capacity remain aligned.
For reporting, compare wrench time against the companion metrics over the same period. A rise in wrench time alongside stable repair quality and improved schedule compliance offers stronger evidence of operational progress.
Teams can use fleet reports and dashboards to review relevant maintenance records and monitor trends, while calculating wrench time separately when their reporting setup does not capture it directly.
Avoid turning wrench time into technician surveillance. If employees believe the percentage determines individual punishment, they may overstate productive hours or avoid recording legitimate delays.
Explain the categories, use the data to improve working conditions, and evaluate shop level patterns before individual performance.
Turning a Low Wrench Time Number Into Action
A low wrench time percentage should start an operational investigation, not an assumption about employee performance.
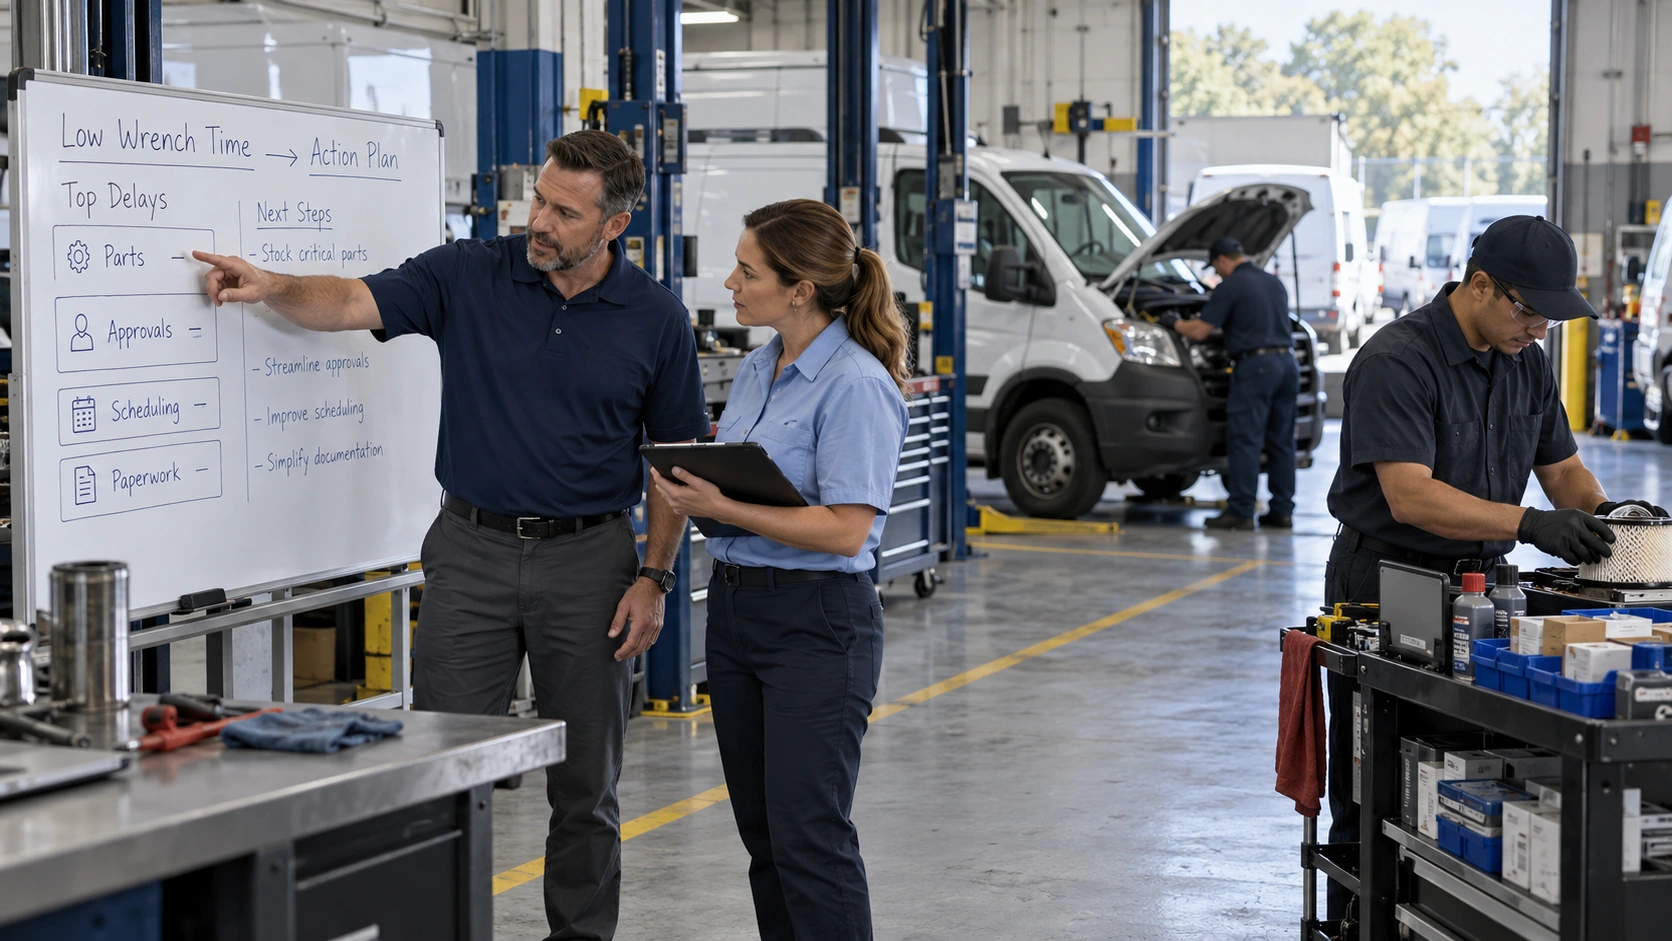
Begin with the largest measured delay category. If parts searches consume significant time, review stocking and preparation. If approvals cause delays, examine authorization responsibilities. If technicians frequently lack assignments, assess scheduling practices.
Look for repeatable fleet performance problems caused by process gaps before making staffing or productivity decisions.
For perspective, a 40 technician operation at 35% wrench time produces the equivalent of 14 technicians spending all their measured time on direct repair work. At 55%, that becomes 22 technician equivalents.
The difference represents additional potential repair capacity from the same payroll, not eight additional employees or guaranteed completed repairs.
Hiring remains difficult in many markets. The U.S. Bureau of Labor Statistics diesel technician outlook projects approximately 24,400 annual openings from 2025 through 2035.
Addressing measurable delays can unlock capacity without waiting for recruitment, although staffing may still need to increase when legitimate workload exceeds available resources.
Ultimately, the goal is not to maximize the percentage at any cost. It is to help technicians perform more necessary maintenance safely, correctly, and with fewer preventable interruptions.
Frequently Asked Questions
-
What is a good wrench time percentage for fleet technicians?
A typical maintenance workforce records 25% to 35% wrench time, while strong operations may reach 55%. Results depend on shop conditions and measurement definitions. -
Does diagnostic time count as wrench time?
Yes. Active vehicle troubleshooting and hands on diagnostics count as wrench time. Waiting for diagnostic equipment, instructions, or approvals does not. -
How can fleet managers measure wrench time accurately?
Use random work sampling or repair activity timers that separate actual maintenance work from waiting, travel, and paperwork. Apply the same definitions consistently. -
Why is technician wrench time low even when the shop is busy?
Missing parts, approval delays, poor scheduling, travel, and administrative work can keep technicians busy without increasing actual repair time. -
How often should fleet shops review wrench time?
Review trends monthly and reassess improvement efforts after 90 days. Keep measurement definitions consistent and compare wrench time alongside repair quality and maintenance compliance.