Miya Bholat
Jun 16, 2026
Is Fleet Activity Creating More Work for Your Team?

Fleet activity creates more work when miles, trips, inspections, fuel records, and maintenance events grow faster than your team's ability to manage them. The solution is not to reduce useful activity. It is to connect every task to a measurable result, automate repetitive administration, and use fleet performance management to separate productive output from avoidable overhead.
Key Takeaways
- More activity does not automatically mean more productivity. Extra miles, trips, and work orders can reflect inefficient routes, repeated repairs, or poor planning.
- Administrative workload is a fleet performance metric. Time spent entering data, chasing updates, and rebuilding reports should count as part of the cost of fleet activity.
- Reactive maintenance multiplies work. A missed service can create an emergency repair, schedule changes, driver delays, and extra communication across several teams.
- Efficient fleets connect activity to outcomes. They compare miles, fuel, labor, maintenance, and completed work rather than judging each metric alone.
- Automation should remove routine work, not visibility. Reminders, digital inspections, centralized records, and reporting tools help teams stay informed with fewer manual steps.
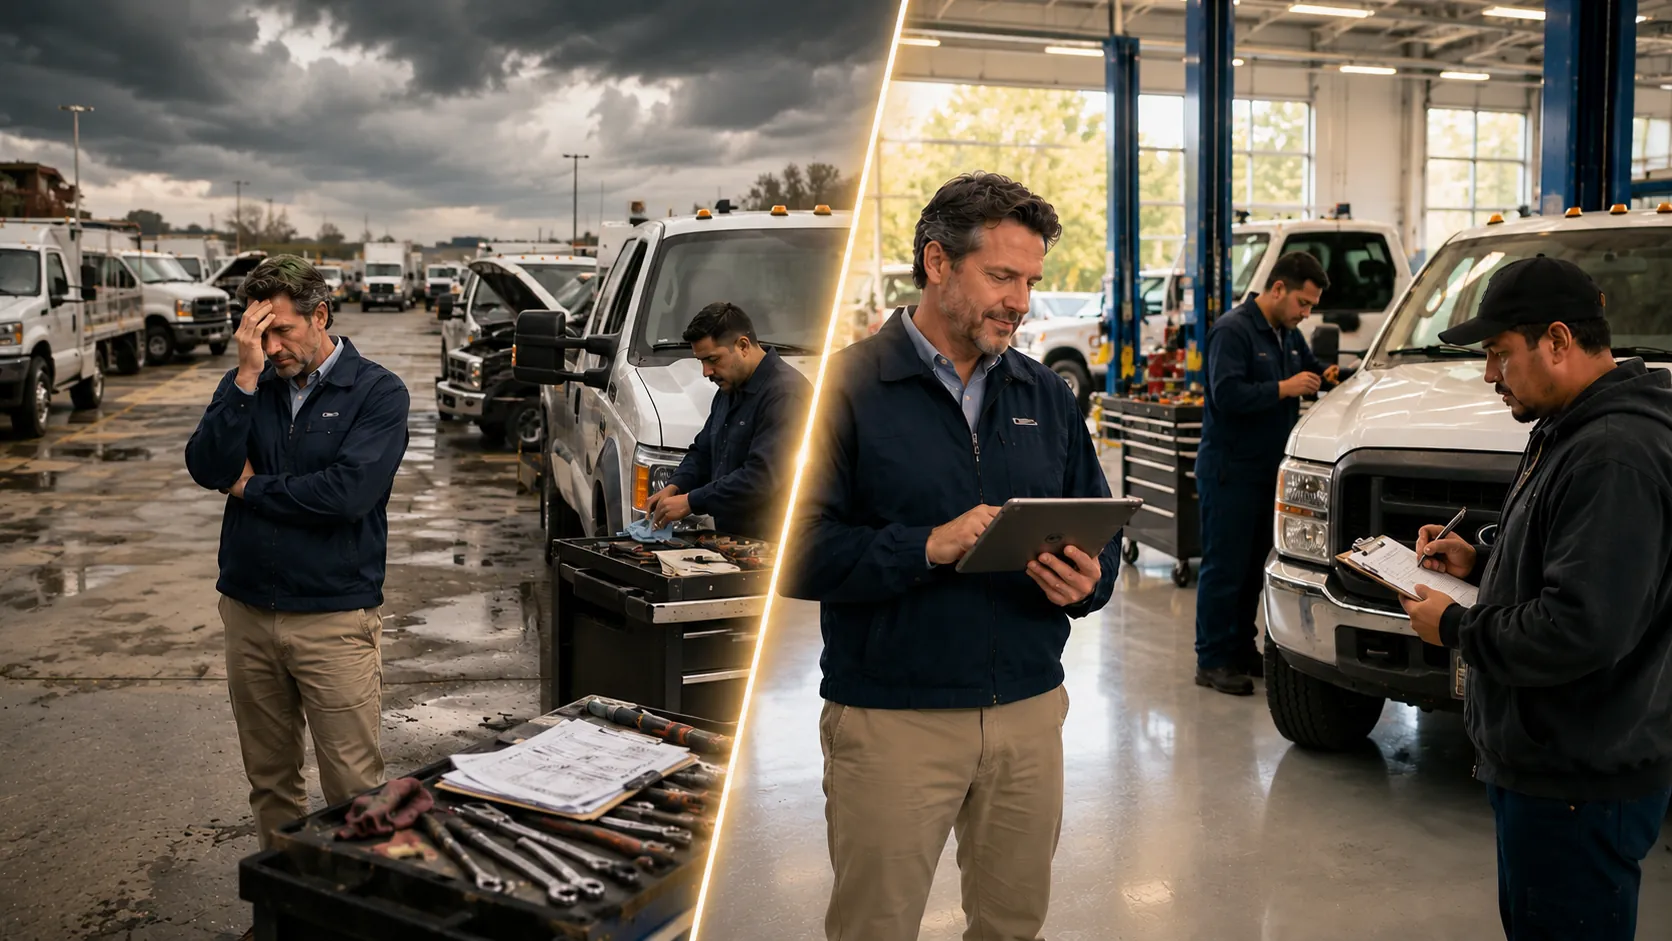
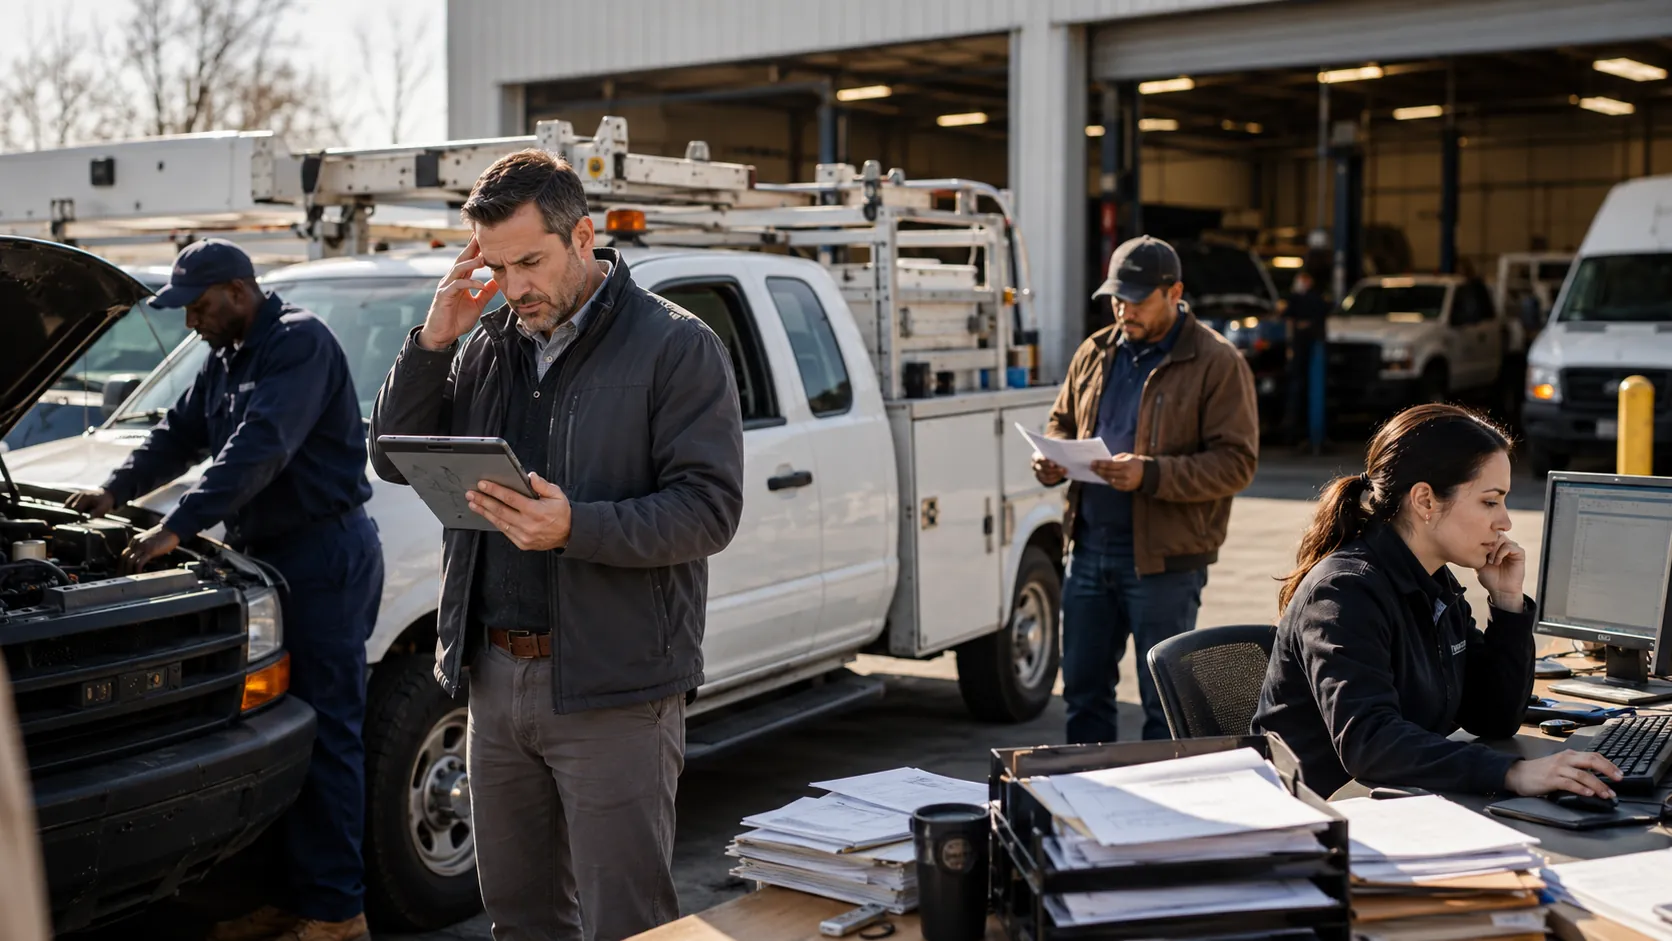
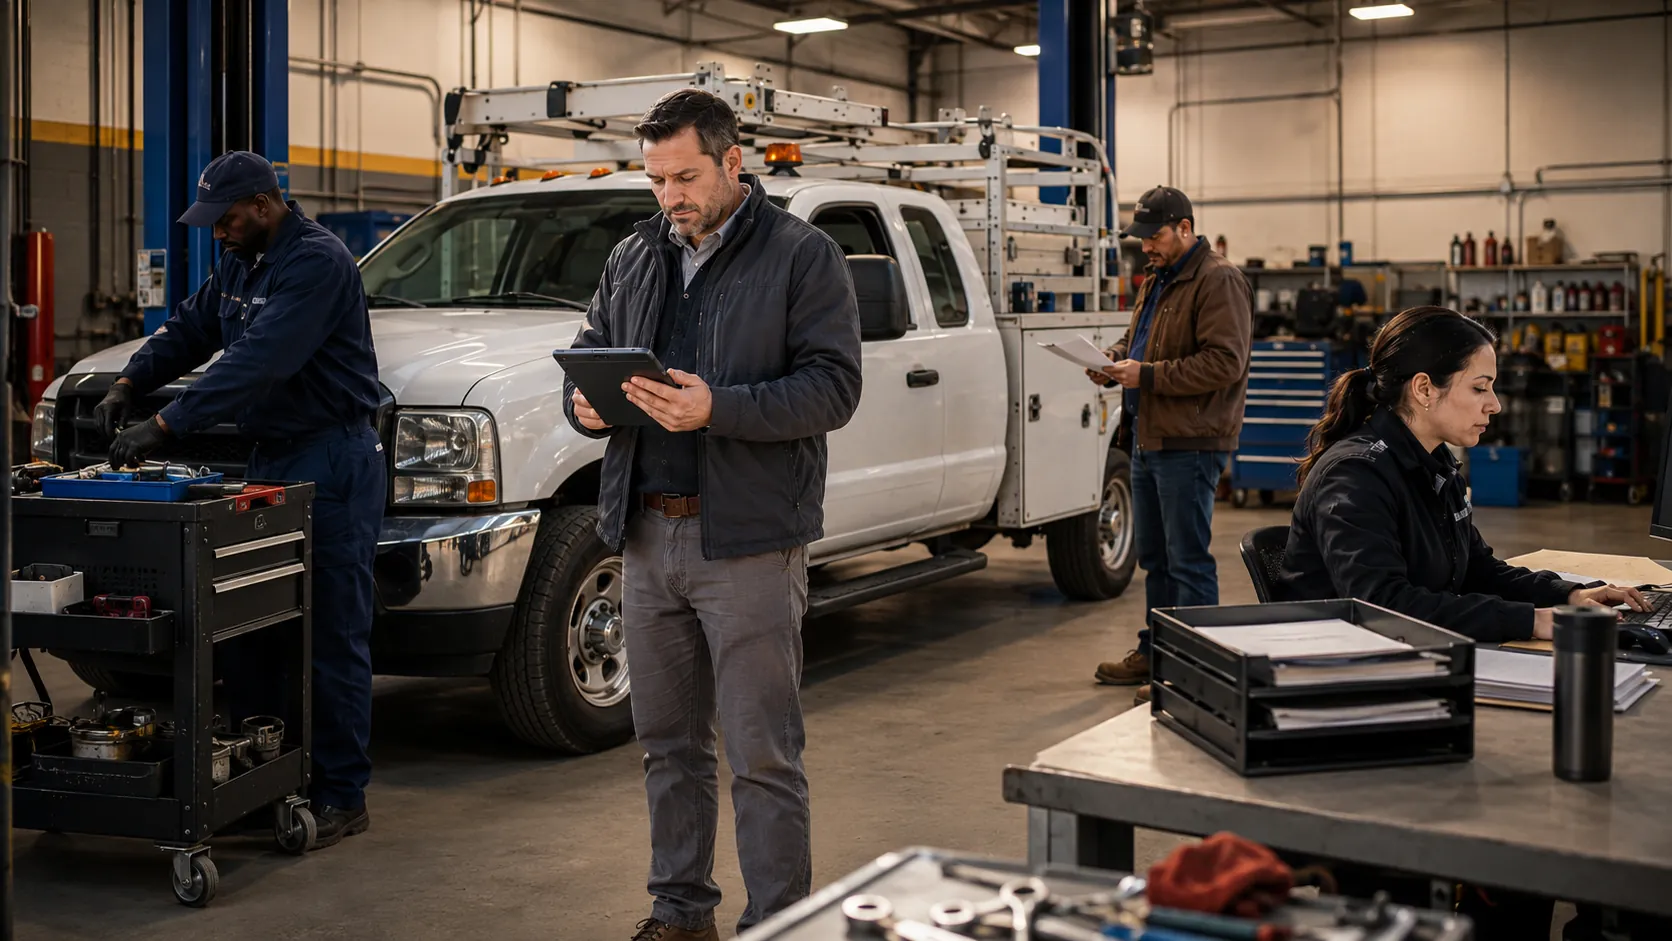
More Vehicles, More Miles: But Is Your Team Actually Ahead?
A busy fleet can look productive from a distance. Vehicles leave the yard, drivers complete trips, and technicians close work orders. Yet managers may spend the day correcting records, finding inspection forms, rescheduling repairs, and answering questions that fleet data should already resolve. More movement can produce more completed work, but it can also produce more administrative drag.
A disciplined approach to fleet optimization strategies helps managers examine the work created around each vehicle, not just the vehicle's movement. The real question is whether additional activity creates enough customer, operational, or financial value to justify the extra coordination it requires.
What "Fleet Activity" Actually Means (And Why It's Misleading)
Fleet activity usually includes miles driven, trips completed, fuel consumed, inspections submitted, service events recorded, and work orders opened. These numbers tell you that something happened. They do not tell you whether that activity created enough value to justify the time, cost, and wear involved.
A fleet that drives 12 percent more miles may have completed more work, used inefficient routes, or duplicated trips. More work orders may show better recordkeeping or repeat failures that preventive maintenance should have stopped. Managers need to connect activity metrics with cost, availability, completed work, and customer results before deciding whether performance improved.
The Difference Between Activity and Output
Activity measures motion and effort. Output measures the useful result. A truck completing 20 trips may look more productive than one completing 12, but the comparison means little without distance, job value, idle time, fuel cost, and service impact.
Closing more work orders is not always a win if technicians keep repairing the same issue. Maintenance creates output when it reduces downtime and prevents future interruptions. The goal is not to maximize the number of actions taken. It is to maximize the useful result produced by those actions.
Common Activity Metrics That Can Mislead Fleet Managers
Several common metrics need context before they can support a decision:
- Total miles driven: More miles may reflect higher demand, but they can also indicate route duplication or unnecessary travel.
- Trips completed: A larger trip count says little about job value, delivery success, or time per stop.
- Work orders closed: High volume can show strong execution or repeated mechanical problems.
- Fuel consumed: Fuel volume usually rises with activity, but fuel per completed job reveals more.
- Vehicle utilization: A high rate can mean productive use, while an extreme rate may leave no capacity for maintenance or demand spikes.
Managers should review utilization beside availability, maintenance needs, and job completion. A practical fleet utilization rate framework can help distinguish healthy use from overuse.
Signs Fleet Activity Is Generating Unnecessary Administrative Work
Unnecessary work often appears in small tasks before it becomes a visible cost problem. One missing inspection record creates a phone call. One unclear service note creates another review. One outdated spreadsheet force someone to compare several versions before scheduling a repair.
Watch for these recurring signs:
- Staff enter the same vehicle information in multiple systems.
- Managers chase drivers or technicians for routine status updates.
- Reports require manual cleanup before anyone trusts them.
- Maintenance schedules change because service needs surface too late.
- Teams cannot quickly connect a cost, repair, or inspection to one vehicle.
Your Maintenance Team Is Always in Reactive Mode
Reactive maintenance creates more than repair work. A failure can trigger towing, driver reassignment, job delays, parts searches, approvals, and customer communication. The coordination may consume more time than the repair.
A proactive team uses service intervals, mileage, engine hours, inspections, and repair history to act earlier. Fleet preventive maintenance schedules help identify upcoming service before a vehicle disrupts operations. That turns maintenance into planned work instead of an ongoing series of emergencies.
Reporting Takes Hours and Still Doesn't Answer the Right Questions
A report has little value when the team spends hours building it and still cannot explain why costs rose. This often happens when fuel, mileage, inspections, maintenance, and driver records live in separate places. The team may produce accurate totals without finding the cause of a performance problem.
Useful reporting should show which vehicles create unplanned work, which routes generate excess mileage, and which repairs affect availability. A centralized fleet reports dashboard reduces report assembly and helps remove time wasting fleet management tasks from the weekly routine.
How to Calculate Whether Fleet Activity Is Worth the Overhead
Start with one week or month of activity. Measure the work your team can identify reliably, then compare it with completed jobs, service calls, deliveries, or another meaningful output. Do not try to calculate every indirect cost during the first review.
Use this simple formula:
Activity overhead per completed job = Total administrative and reactive labor cost divided by completed jobs
The table below shows an illustrative weekly calculation for a service fleet:
| Measure | Example | Why it matters |
|---|---|---|
| Completed jobs | 420 | Represents useful output |
| Manual administration | 36 hours at $32 | Equals $1,152 in labor |
| Reactive coordination | 48 hours at $45 | Equals $2,160 in labor |
| Total activity overhead | $3,312 | Combines avoidable support work |
| Overhead per completed job | $7.89 | Shows the hidden cost attached to each job |
Track this number over time. If completed jobs stay flat while overhead per job rises, the fleet is creating more work without producing more value. Compare branches or vehicle types to locate the cause.
A practical workflow keeps the calculation consistent:
- Capture activity: Record miles, trips, fuel, inspections, repairs, and completed work.
- Count support hours: Include data entry, reporting, update chasing, rescheduling, and reactive coordination.
- Convert hours to cost: Multiply each role's hours by its estimated hourly labor cost.
- Divide by output: Use completed jobs, deliveries, or service calls as the output measure.
- Review the trend: Compare the result each month and investigate material increases.
What Efficient Fleets Do Differently to Manage Activity
Efficient fleets create a repeatable system around activity. Managers know what drivers must submit, which maintenance triggers require action, and which measures deserve review. Each person understands what they own and when they need to act.
Their operating habits usually include the following:
- They schedule maintenance before demand forces a rushed decision.
- They centralize vehicle records so teams work from the same information.
- They assign clear responsibility for inspections, approvals, and follow up.
- They use alerts for exceptions rather than checking every record manually.
- They review cost and output together during regular performance meetings.
They Tie Every Activity to a Measurable Outcome
A trip should connect to a customer visit, completed job, or delivery. Fuel should connect to a vehicle and mileage period. Maintenance should connect to improved availability or a known service requirement.
Digital mileage records make this comparison easier because managers can connect movement with actual work. Trip and mileage tracking helps show whether additional travel supports more output or simply adds cost. The same logic should apply to maintenance, inspections, fuel, and driver activity.
They Automate the Low Value Work So Teams Focus on High Value Decisions
Automation works best when it removes predictable steps. Reminders replace calendar checks, inspection alerts replace follow up calls, and standard reports replace spreadsheet consolidation. Managers still make the decision without spending hours collecting evidence.
Start with repetitive tasks that follow clear rules and happen frequently. The fleet management automation priorities should usually include reminders, recurring reports, inspection notifications, and service scheduling before more complex workflows.
How Fleet Management Software Cuts Work Without Cutting Activity
Fleet management software creates one operating record for vehicles, drivers, maintenance, fuel, inspections, and documents. It does not reduce productive activity. It reduces duplicate entry and the manual work required to organize it.
AUTOsist can help teams track service history, schedule maintenance, send reminders, review dashboards, and store inspection results without rebuilding the same record in several places. A digital vehicle inspection app can route submitted issues into a visible process, while centralized records help managers see what happened next.
This structure matters in high activity operations such as trucking and logistics fleet management, where small information delays can affect dispatch, maintenance, and customer commitments. The goal is simple: keep the vehicles working while reducing the coordination burden placed on the people managing them.
Key Questions to Ask About Your Fleet's Productivity Right Now
Use these questions as a quick self audit:
- How many hours does the team spend entering, correcting, or combining fleet data each week?
- What percentage of maintenance work is scheduled compared with reactive?
- Can we connect extra miles or trips to more completed work or revenue?
- Which vehicles generate the most repeat repairs, follow up, or schedule changes?
- How long does it take to produce a report that managers trust?
- Which routine updates could move to reminders, alerts, or digital forms?
Look for a repeatable relationship between activity, cost, workload, and completed work. When output grows faster than administrative overhead, productivity is improving. When overhead grows faster, the process needs attention.
Frequently Asked Questions
-
How do I know if my fleet is productive or just busy?
Compare activity with outcomes. Review miles, trips, fuel, and maintenance beside completed jobs, vehicle availability, cost per job, and administrative hours. A productive fleet creates more useful output without an equal increase in overhead. -
What is a good fleet utilization rate?
A good rate depends on vehicle type, demand, and required spare capacity. The best target keeps vehicles productive while leaving enough time for maintenance and unexpected demand. A very high rate can create failures if vehicles never have time for planned service. -
Can fleet management software reduce my team's workload?
Yes, when it replaces duplicate entry, manual reminders, spreadsheet reporting, and status chasing. The largest gains usually come from centralizing records and automating routine notifications while keeping responsibility clear. -
What causes fleet administrative costs to increase?
Common causes include disconnected systems, manual reporting, unclear ownership, reactive maintenance, missing inspection information, and repeated data entry. Activity growth makes each weakness more expensive because the team repeats the same inefficient process more often. -
How can I measure fleet efficiency without expensive tools?
Start with a spreadsheet and track completed work, total miles, fuel, maintenance hours, and administrative hours for one month. Calculate overhead per completed job and compare it over time. The method matters more than the tool at the beginning.