Miya Bholat
Jun 12, 2026
7 Early Signs Your Fleet Maintenance Backlog Is Growing
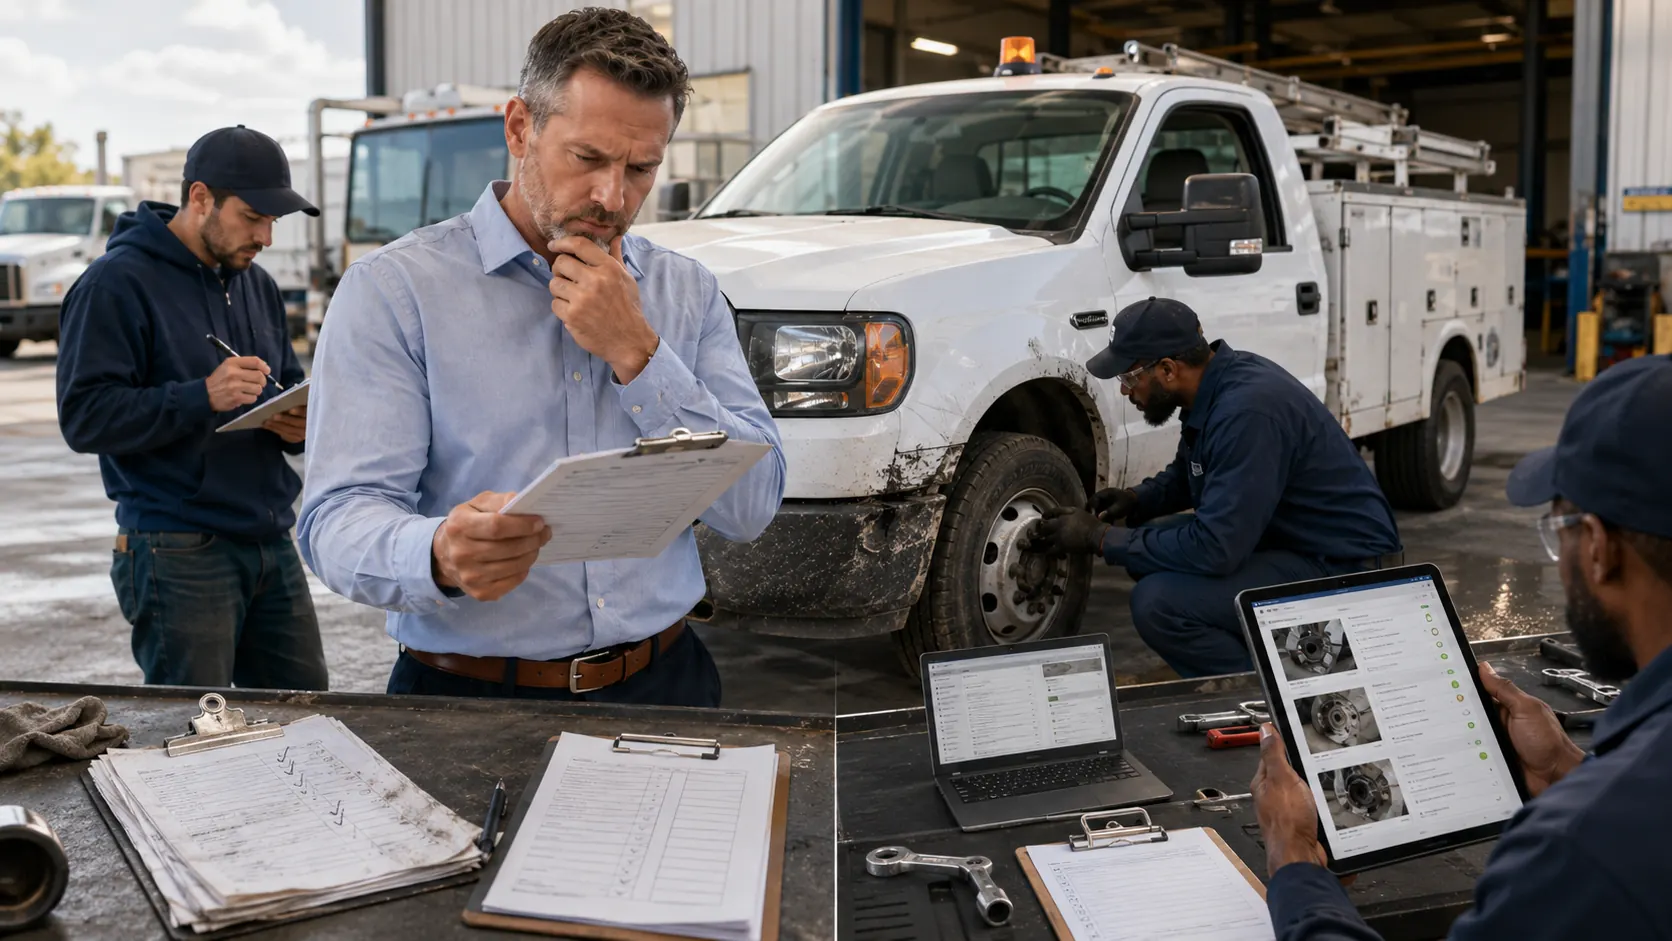
A growing fleet maintenance backlog means maintenance work is piling up faster than your team can complete it, even if the fleet still looks like it is running normally. The solution starts with visibility: tracking overdue service, open work orders, repeated defects, downtime, and vehicle cost patterns in one place through a reliable fleet maintenance software process before small delays turn into expensive failures.
Most fleet managers do not notice backlog growth on day one. A preventive maintenance task gets moved because a truck is needed for a route. A driver reports the same issue twice. A mechanic closes an urgent repair while a lower priority inspection waits another week. Everything feels under control until one vehicle breaks down unexpectedly and the team realizes the missed work has been stacking up for weeks.
That is why backlog is dangerous financially, not just operationally. It does not only create downtime. It increases emergency labor, parts costs, repeat repairs, driver frustration, and replacement pressure. The earlier you recognize the warning signs, the easier it is to correct the pattern before it becomes a crisis.
Key Takeaways
-
A backlog is more than overdue work orders
It includes delayed PMs, skipped inspections, incomplete repairs, and unresolved driver reported issues. -
Consistent PM delays are an early warning sign
One missed service date is manageable, but repeated delays across vehicles point to a system problem. -
Work order flow shows whether the shop is catching up or falling behind
If new work orders keep outpacing closed work orders, the backlog is growing every week. -
Repeat defects usually mean repairs are not solving the root cause
When drivers report the same issue repeatedly, the fleet may be paying for temporary fixes instead of complete repairs. -
Unplanned downtime exposes hidden maintenance debt
Rising breakdowns often show that deferred work is starting to affect vehicle availability. -
Better visibility helps teams prioritize before costs spike
Centralized maintenance records, alerts, inspections, and reports make backlog easier to identify and control.
What Is a Fleet Maintenance Backlog (and Why It Sneaks Up on You)
A fleet maintenance backlog is the total amount of maintenance work that should have been completed but has not been finished yet. That includes overdue preventive maintenance, open work orders, pending inspections, unresolved driver defects, parts delays, incomplete repairs, and vehicles waiting for follow up service.
It sneaks up because vehicles often keep running even when maintenance is falling behind. A truck may still complete routes after a delayed oil change. A van may pass daily use even with a recurring brake noise. A piece of equipment may keep working with a small leak until that small issue becomes a major repair. By the time the backlog becomes visible, the fleet may already be dealing with downtime and higher costs.
The clearest signs usually appear in patterns. Watch for these warning signals:
- Preventive maintenance intervals keep getting pushed back
- Open work orders are increasing faster than closures
- Drivers keep reporting the same defects
- Unplanned downtime starts rising
- Certain vehicles become repair cost outliers
- The team spends more time reacting than planning
Sign #1: Preventive Maintenance Intervals Are Getting Pushed Back Consistently
Preventive maintenance delays are one of the earliest signs that backlog is building. Every fleet occasionally reschedules service because a vehicle is needed, parts are late, or a technician is unavailable. That does not automatically mean the operation is in trouble.
The issue starts when delays become normal. If oil changes, tire rotations, brake inspections, and equipment checks are regularly moved out another week, the fleet is no longer following a preventive strategy. It is borrowing time from future repairs.
A simple way to catch this early is to monitor PM compliance. If 90 percent of scheduled services are completed on time, the backlog is likely manageable. If that drops to 70 percent or lower for multiple weeks, the team should investigate why the schedule is slipping. Fleets using preventive maintenance schedules can spot overdue service by vehicle, mileage, hours, or date before those delays become expensive breakdowns.
The Difference Between One Delay and a Pattern
One delayed PM is a scheduling issue. Repeated delays across multiple vehicles are a maintenance backlog signal. For example, pushing an oil change once may not create immediate damage. But if several trucks run thousands of miles beyond service intervals, engine wear, fluid contamination, and inspection failures can all become more likely.
A pattern usually means the fleet lacks capacity, visibility, or prioritization. The schedule may exist, but the team is not closing the loop. Reviewing fleet scheduled maintenance best practices can help managers compare their current process against a more proactive maintenance rhythm.
Sign #2: Your Work Order Queue Keeps Growing Faster Than It's Closing
Your work order queue tells a simple story. If more work is being opened than completed, the backlog is growing. This is one of the easiest maintenance health metrics to calculate because it does not require complex reporting.
Here is the basic formula:
| Weekly Work Order Metric | Example |
|---|---|
| New work orders opened | 20 |
| Work orders closed | 14 |
| Net backlog growth | 6 |
| Four week added backlog | 24 |
If that pattern continues for a month, the team is not just busy. It is falling behind. A healthy fleet maintenance operation should either close work at the same pace it opens or have a clear plan for why certain work is being held.
How to Calculate Your Backlog Ratio
To calculate backlog ratio, divide closed work orders by opened work orders for a set period. If the team opens 20 work orders and closes 14, the completion ratio is 70 percent. That means 30 percent of work is rolling forward into the next week.
A strong ratio depends on fleet size, shop capacity, and repair complexity, but the trend matters more than one number. If the ratio declines for several weeks, the shop needs to review staffing, parts availability, repair priority, and scheduling. A centralized fleet maintenance work order software process makes it easier to see which repairs are open, assigned, delayed, or waiting on parts.
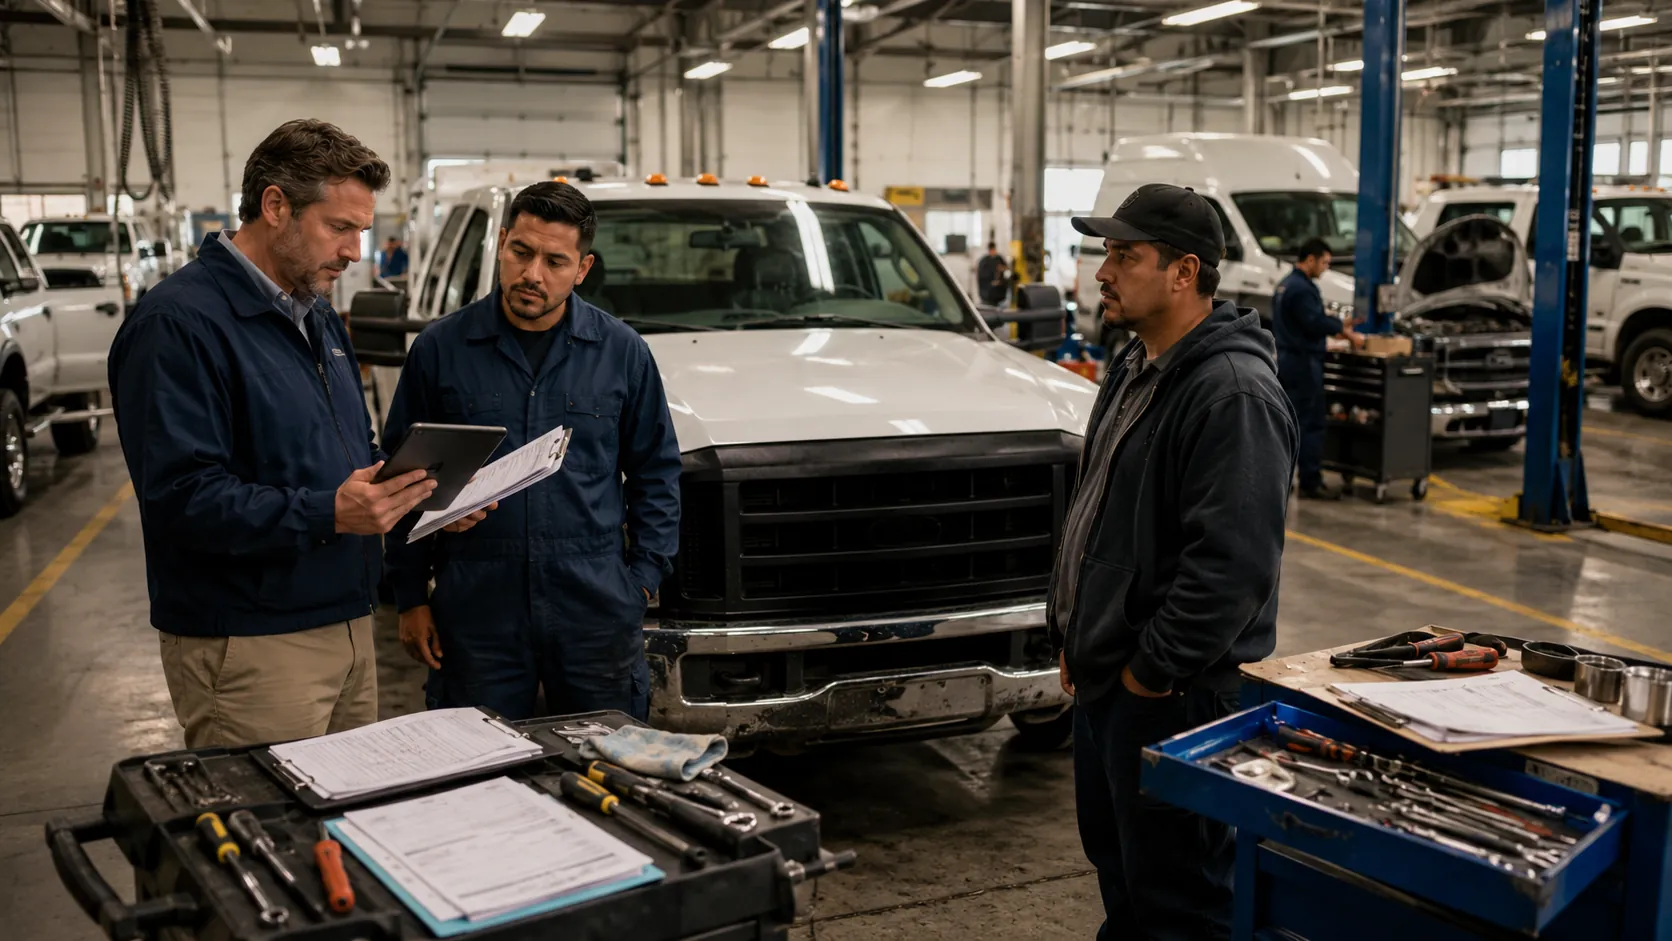
Sign #3: Drivers Are Reporting the Same Issues Repeatedly
Driver reports are often the first place backlog shows up. Drivers notice noises, leaks, warning lights, handling changes, and inspection issues before managers see them in cost reports. When the same issue appears again and again, it usually means something was not fully resolved.
For example, a driver may report that a vehicle pulls to one side. If the issue is marked complete without alignment, tire, suspension, or steering follow up, the same complaint may return within days. That repeat cycle wastes time and increases risk.
Repeat Defects Signal Incomplete Repairs
Repeat defects often happen when repairs are rushed, documentation is weak, or the team only fixes symptoms. Driver vehicle inspection reports should help identify these repeat patterns. If the same vehicle keeps appearing with the same defect, the repair history needs closer review.
A digital vehicle inspection app can connect driver reported issues to repair records, photos, and follow up tasks. That gives managers a better chance to catch repeated defects before they become repeat breakdowns.
Sign #4: Vehicle Downtime Is Increasing Without a Clear Cause
Downtime is not always bad. Planned downtime means a vehicle is taken out of service for scheduled maintenance. That is part of a healthy fleet process. Unplanned downtime is different because it usually means a vehicle failed when the fleet needed it.
When unplanned downtime increases, backlog may be catching up with the operation. Delayed PMs, unresolved inspection issues, and incomplete repairs all reduce vehicle reliability over time. The team may feel like breakdowns are random, but the records often reveal that warning signs appeared earlier.
Unplanned vs. Planned Downtime — Know the Ratio
Fleet managers should separate downtime into planned and unplanned categories. Planned downtime should be controlled, scheduled, and expected. Unplanned downtime should trigger investigation.
Here is a simple downtime review workflow:
A strong fleet downtime management process helps managers connect today's breakdowns with yesterday's missed maintenance signals.
Sign #5: Maintenance Costs Are Spiking on Specific Vehicles
A growing backlog does not always affect every vehicle equally. Some vehicles become problem units because small issues keep getting delayed. The first clue may not be downtime. It may be cost.
A truck with repeated tire replacements, brake repairs, check engine lights, or fluid leaks may look like a high cost asset. But the real issue may be that previous maintenance was delayed, rushed, or not documented clearly enough. When backlog builds around one vehicle, costs can spike before anyone connects the trend.
The "Problem Vehicle" Pattern
Problem vehicles usually show a combination of high repair frequency, repeated complaints, and rising cost per mile. Fleet managers should compare vehicles by repair spend, downtime, work order count, and inspection history.
Look for these cost warning signs:
- One vehicle has far more work orders than similar assets
- Repairs repeat within a short time window
- Emergency repairs replace planned maintenance
- Parts spend rises without a clear explanation
- Service history shows gaps before major repairs
Tracking vehicle service history helps managers see whether a vehicle is truly unreliable or whether unresolved backlog is creating the problem.
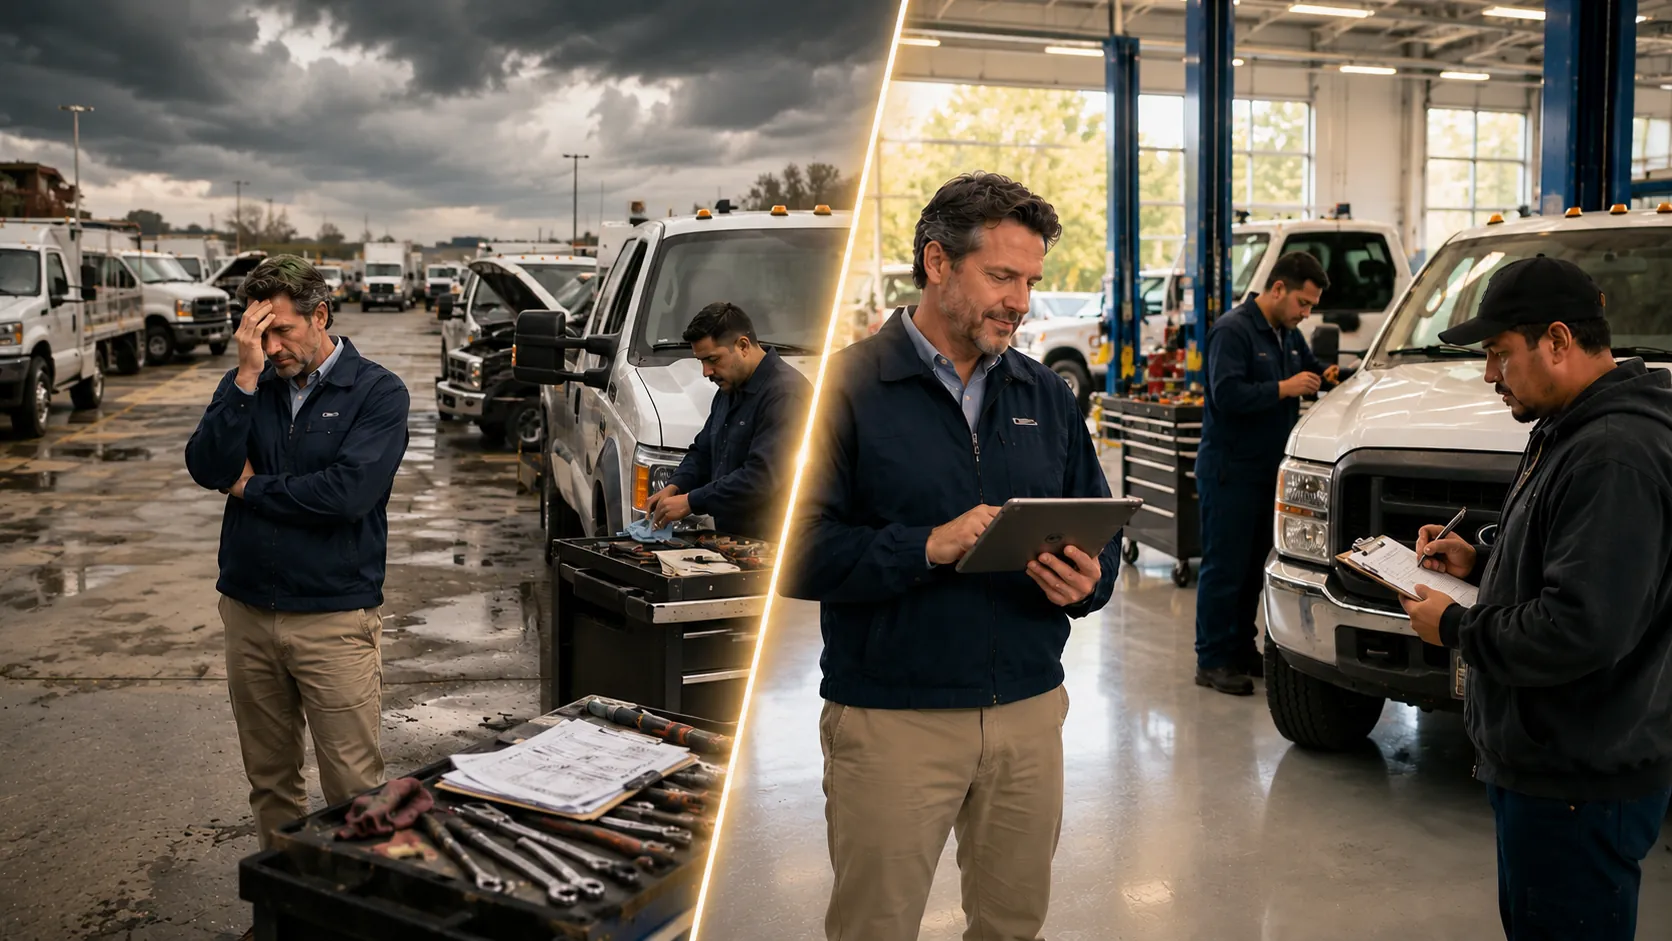
Sign #6: Your Team Is Always in Reactive Mode
A reactive shop spends most of its time dealing with urgent repairs. Technicians jump from one breakdown to another. Managers rearrange schedules daily. Drivers wait for updates. Parts are ordered in a rush. The team may work hard, but the backlog keeps growing because planned maintenance never gets enough attention.
This culture becomes expensive quickly. Emergency repairs can raise parts costs, increase overtime, reduce vehicle availability, and create burnout. It also makes planning difficult because every day begins with a new crisis.
What "Firefighting" Culture Costs a Fleet
Reactive maintenance creates hidden costs across the operation:
- More overtime for urgent repairs
- Higher parts costs from rushed purchasing
- Lower vehicle availability during peak demand
- More driver frustration from unreliable assets
- Less time for inspections and preventive work
The goal is not to eliminate every surprise. No fleet can do that. The goal is to reduce avoidable emergencies by catching backlog early and protecting time for planned work. Fleets trying to move away from constant emergencies can use reactive maintenance reduction strategies to rebuild a more proactive process.
Sign #7: You Don't Have Reliable Visibility Into What's Overdue
The most dangerous backlog is the one you cannot see. If a fleet manager cannot quickly pull a list of overdue PMs, open work orders, unresolved inspection defects, and vehicles past service due dates, the backlog is already harder to manage.
Spreadsheets, paper forms, text messages, and disconnected folders can work for a small period of time. But as the fleet grows, information gets missed. A repair note sits in a glove box. A PM date gets changed without follow up. A defect is reported but never assigned. The backlog grows because no one has a complete view.
The Hidden Backlog Problem: You Don't Know What You Don't Know
Hidden backlog usually appears when teams rely on memory instead of systems. The manager may know the urgent repairs but not the overdue inspections. The mechanic may know which truck needs parts but not which PMs are past due. The driver may report issues that never make it into the maintenance plan.
A visibility focused maintenance process should answer these questions quickly:
- Which vehicles are overdue for service?
- Which work orders are still open?
- Which defects were reported more than once?
- Which repairs are waiting on parts?
- Which assets are driving the most cost?
A reporting process built around a fleet reports dashboard helps turn backlog from a hidden problem into a visible management priority.
How to Stop a Growing Backlog Before It Becomes a Crisis
Stopping backlog growth starts with an honest audit. Fleet managers need to know what is open, what is overdue, what affects safety, and what can be scheduled later. Without that first cleanup, the team may keep reacting to whichever issue is loudest.
Start by pulling every open work order, overdue PM, failed inspection item, and unresolved driver complaint into one list. Then separate urgent safety risks from lower risk maintenance. This prevents the team from treating every delayed task the same way.
Prioritize by Risk, Not Just by Date
The oldest item is not always the most important item. A minor cosmetic repair that is 60 days old may be less urgent than a brake complaint from yesterday. Prioritization should consider safety, compliance, downtime risk, asset importance, and repair cost escalation.
Use this simple priority model:
| Priority Level | Maintenance Example | Action |
|---|---|---|
| Critical | Brake issue, steering issue, major leak | Remove from service and repair immediately |
| High | Overdue PM on high use vehicle | Schedule within the week |
| Medium | Repeat non safety defect | Diagnose root cause |
| Low | Cosmetic or convenience issue | Batch with future service |
Build a Backlog Reduction Plan Your Team Can Actually Execute
A backlog plan should be realistic. If the team can close 15 work orders per week, setting a target of 40 will fail. Instead, set weekly closure goals, protect technician time, and review progress every week.
A practical backlog reduction workflow looks like this:
For larger or mixed fleets, a clear fleet maintenance audit checklist can help managers review records, inspection gaps, and overdue maintenance before the backlog becomes unmanageable.
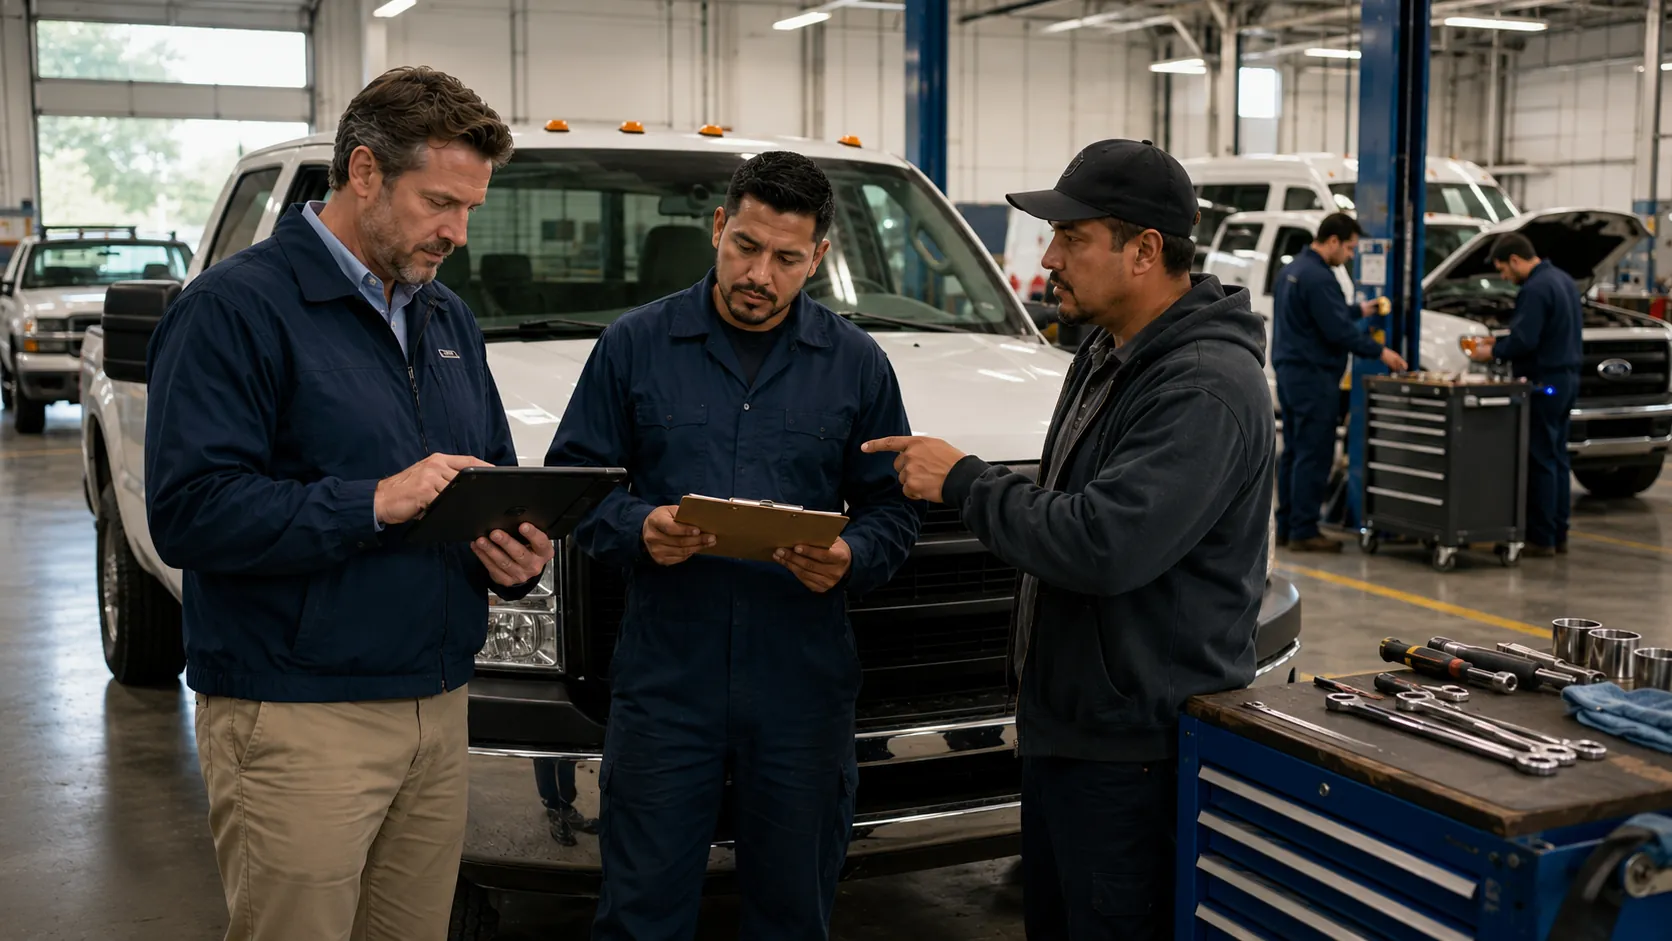
How Fleet Maintenance Software Keeps Backlog Visible and Manageable
Fleet maintenance software keeps backlog manageable by making overdue work visible before it turns into downtime. Instead of relying on paper logs, spreadsheets, or memory, managers can track PM schedules, open work orders, inspections, service history, and alerts in one system.
AUTOsist supports this process by helping teams schedule preventive maintenance, create and track work orders, document inspections, review vehicle service history, and monitor maintenance activity through reports. These tools are useful because backlog is rarely one single problem. It is usually a mix of missed intervals, incomplete repairs, repeated defects, and unclear ownership.
For example, preventive maintenance alerts can show which vehicles are approaching service. Work order tracking can show which repairs are open and who owns them. Inspection records can reveal repeat driver defects. Service history can help managers identify vehicles that are becoming cost outliers.
This matters across industries too. A construction fleet maintenance process may need to track equipment hours and jobsite readiness, while a service fleet may care more about route availability and customer commitments. The core need is the same: keep maintenance visible, prioritized, and documented so backlog does not quietly become the reason vehicles stop working.
Frequently Asked Questions
-
What are the first signs that a fleet maintenance backlog is growing?
The earliest warning signs usually include delayed preventive maintenance, increasing open work orders, repeat driver reported defects, and more vehicles waiting for service. These issues often appear weeks before major breakdowns begin affecting fleet availability. -
How many overdue work orders should a fleet have before it's a concern?
There is no universal number because it depends on fleet size. The bigger concern is whether new work orders are being created faster than existing ones are being completed. If the gap continues to grow week after week, the backlog is becoming a risk. -
Why do the same vehicles keep showing up in maintenance reports?
Repeated maintenance activity on the same vehicles often indicates unresolved root causes, delayed repairs, or incomplete inspections. Tracking service history can help identify whether recurring costs are connected to a growing backlog. -
How does a maintenance backlog increase fleet operating costs?
A backlog often leads to emergency repairs, more downtime, higher labor costs, expedited parts purchases, and shortened asset life. Small maintenance delays frequently become larger and more expensive repairs when left unresolved. -
How can fleet maintenance software help prevent maintenance backlog?
Fleet maintenance software helps by tracking preventive maintenance schedules, work orders, inspections, service history, and overdue tasks in one place. This visibility allows managers to identify backlog trends early and prioritize maintenance before vehicles become unavailable.