 Miya Bholat
Nov 19, 2026
Pest Control Fleet Management: What Managers Should Track
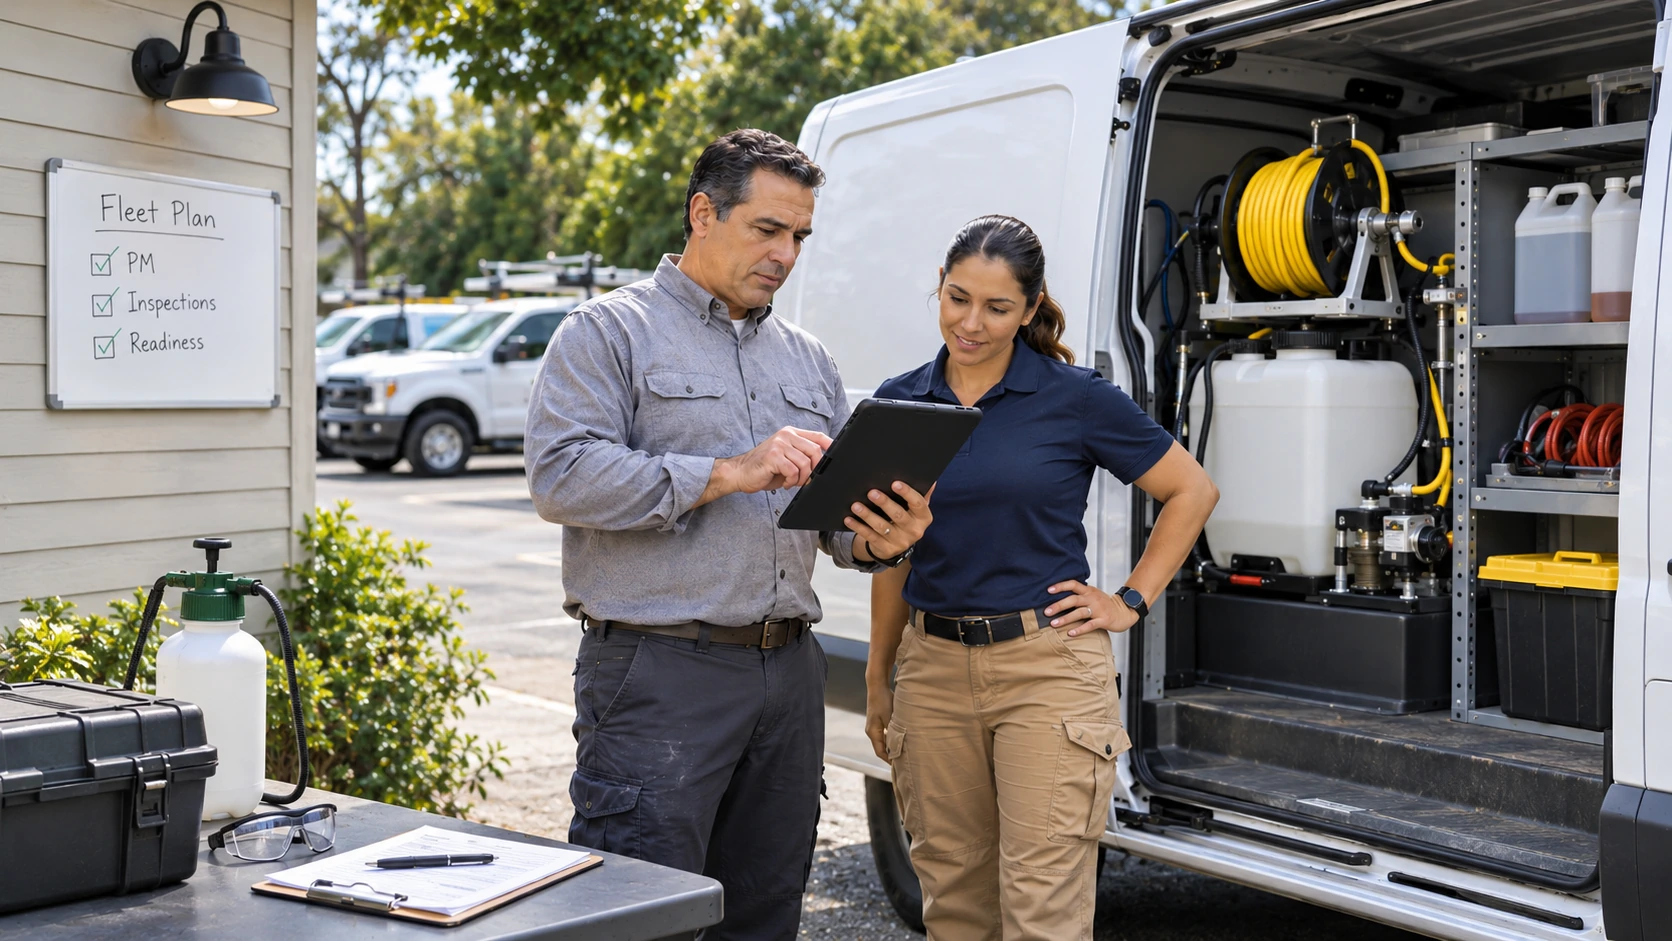
Pest control fleet management involves tracking vehicle maintenance, cost per stop, vehicle availability, fuel consumption, application equipment, chemical inventory, and compliance records to keep technicians productive and service routes profitable.
With an organized fleet management system, pest control managers can identify developing maintenance problems, reduce unexpected downtime, and control operating expenses without spending hours managing vehicle records.
Key Takeaways
- Measure cost per stop instead of just cost per mile. Completed customer visits provide a more meaningful measure of fleet efficiency.
- Prioritize vehicle availability. An unavailable vehicle can disrupt an entire service route and reduce technician productivity.
- Track maintenance at consistent intervals. Daily, weekly, and monthly reviews help identify problems before they interrupt operations.
- Treat application equipment as individual assets. Sprayers, pumps, tanks, and hose reels require independent maintenance records.
- Prepare vehicles before peak season. Completing preventive maintenance early reduces the risk of breakdowns when customer demand increases.
Why Pest Control Fleets Are Harder to Manage Than They Look
Pest control fleets face a combination of frequent stops, specialized equipment requirements, chemical transportation risks, and seasonal fluctuations that make vehicle management more complicated than ordinary commercial fleet operations.
A technician might visit 10 to 20 customers daily while carrying pesticides, application equipment, and protective gear. Every vehicle effectively operates as a mobile warehouse and service station.
According to Specialty Consultants' analysis of the 2025 pest control industry, published by the National Pest Management Association in April 2026:
- The industry generated $13.416 billion in service revenue.
- Service revenue increased by 6% compared with 2024.
- The industry employed approximately 109,384 service technicians.
- 36.8% of surveyed businesses reported that technician shortages constrained growth.
- Of the 16,565 pest control businesses, 81.4% operated from one or two locations.
When qualified technicians are already difficult to find, losing their productive hours to vehicle breakdowns makes little financial sense. Effective field service fleet management becomes as much a revenue protection strategy as a maintenance responsibility.
The Core Metrics Every Pest Control Fleet Manager Should Track
Pest control fleet managers should prioritize four metrics that directly connect vehicle performance with service delivery, operating costs, and technician productivity.
Cost Per Stop and Cost Per Route
Cost per stop measures how much a business spends on vehicle operations for every completed customer visit. Unlike cost per mile, it accounts for the actual service output of each vehicle.
Cost per stop = (Fuel + Maintenance + Depreciation + Insurance) ÷ Completed stops
Consider the following illustrative monthly costs for a pest control van.
| Expense | Monthly Cost |
|---|---|
| Fuel | $450 |
| Maintenance | $250 |
| Depreciation | $400 |
| Insurance | $150 |
| Total vehicle cost | $1,250 |
| Completed stops | 300 |
| Cost per stop | $4.17 |
If the vehicle completes 20 routes during the same month, its average vehicle cost per route is $62.50.
Tracking fleet cost per job helps managers compare vehicles and identify whether rising expenses or declining route productivity are reducing profitability.
Vehicle Availability and Downtime Days
Vehicle availability measures the percentage of scheduled operating time during which vehicles remain ready for service.
Vehicle availability = Available vehicle days ÷ Scheduled vehicle days × 100
For example, a fleet of 10 vehicles scheduled to operate for 20 days has 200 scheduled vehicle days. If breakdowns and maintenance account for eight unavailable days, fleet availability is 96%.
A 2026 fleet downtime study from Expert Market, involving 400 US fleet professionals across construction, field services, and utilities, estimated an average breakdown cost of $2,491 per incident. This represents a broader commercial fleet benchmark rather than a pest control specific figure.
During peak season, a single unavailable van could disrupt 10 to 20 scheduled customer visits unless another properly equipped vehicle can cover the route.
Preventive Maintenance Compliance Rate
Preventive maintenance compliance measures how consistently a fleet completes scheduled maintenance before its due date or mileage threshold.
PM compliance rate = Maintenance services completed on time ÷ Total maintenance services due × 100
Pest control vehicles experience frequent acceleration, braking, short trips, and extended idling. These operating conditions can increase component wear even when odometer readings remain relatively low.
Establish preventive maintenance schedules using manufacturer recommendations, actual operating conditions, mileage, and elapsed time. Aim to complete every scheduled service on time.
Fuel Spend and Miles Per Route
Fuel spending helps managers identify inefficient routes, unnecessary idling, and changes in vehicle performance.
Calculate fuel cost per route by dividing total fuel expenses by completed routes over the same reporting period. Compare the result against route mileage and completed stops.
A centralized fleet fuel management system helps identify unusual spending patterns before they become recurring expenses.
A Daily, Weekly, and Monthly Tracking Cadence for Pest Control Fleets
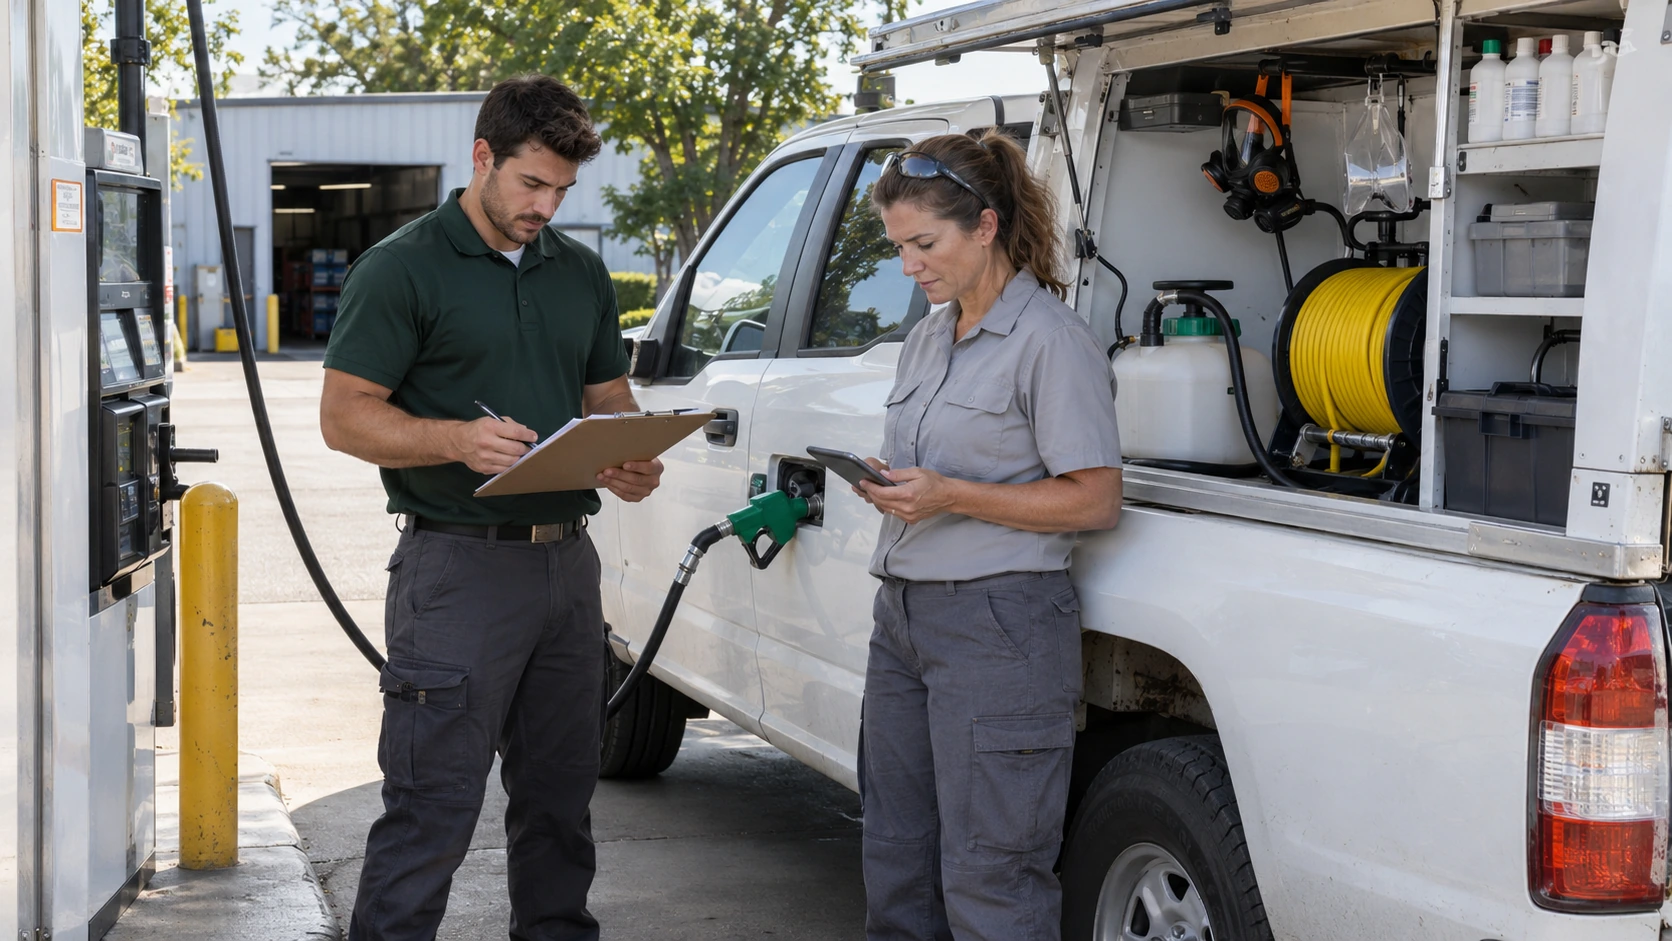
Pest control businesses can manage fleet performance without a dedicated fleet department by assigning different tracking responsibilities to daily, weekly, and monthly reviews.
| Cadence | What to Check | Why It Matters |
|---|---|---|
| Daily | Vehicle walkaround, tank leaks, sprayer condition, fuel logs, odometer readings | Prevents unsafe dispatch and service interruptions |
| Weekly | Upcoming maintenance, unresolved defects, fuel expenses per route | Identifies developing maintenance and operating cost problems |
| Monthly | Cost per stop, downtime days, tire and brake wear, document expirations | Supports budgeting, compliance, and replacement decisions |
Establishing a consistent fleet tracking and reporting cadence keeps essential information visible without overwhelming managers with unnecessary reports.
Weekly Fleet Management Workflow
Managers can aim to complete their routine weekly review in under 30 minutes when technicians update records daily.
The total routine review takes approximately 27 minutes, excluding repair coordination and monthly reporting.
Technicians should follow a standardized vehicle inspection checklist and report safety concerns immediately rather than waiting for the weekly review.
Tracking the Equipment Riding in the Truck: Sprayers, Tanks, and Chemical Inventory
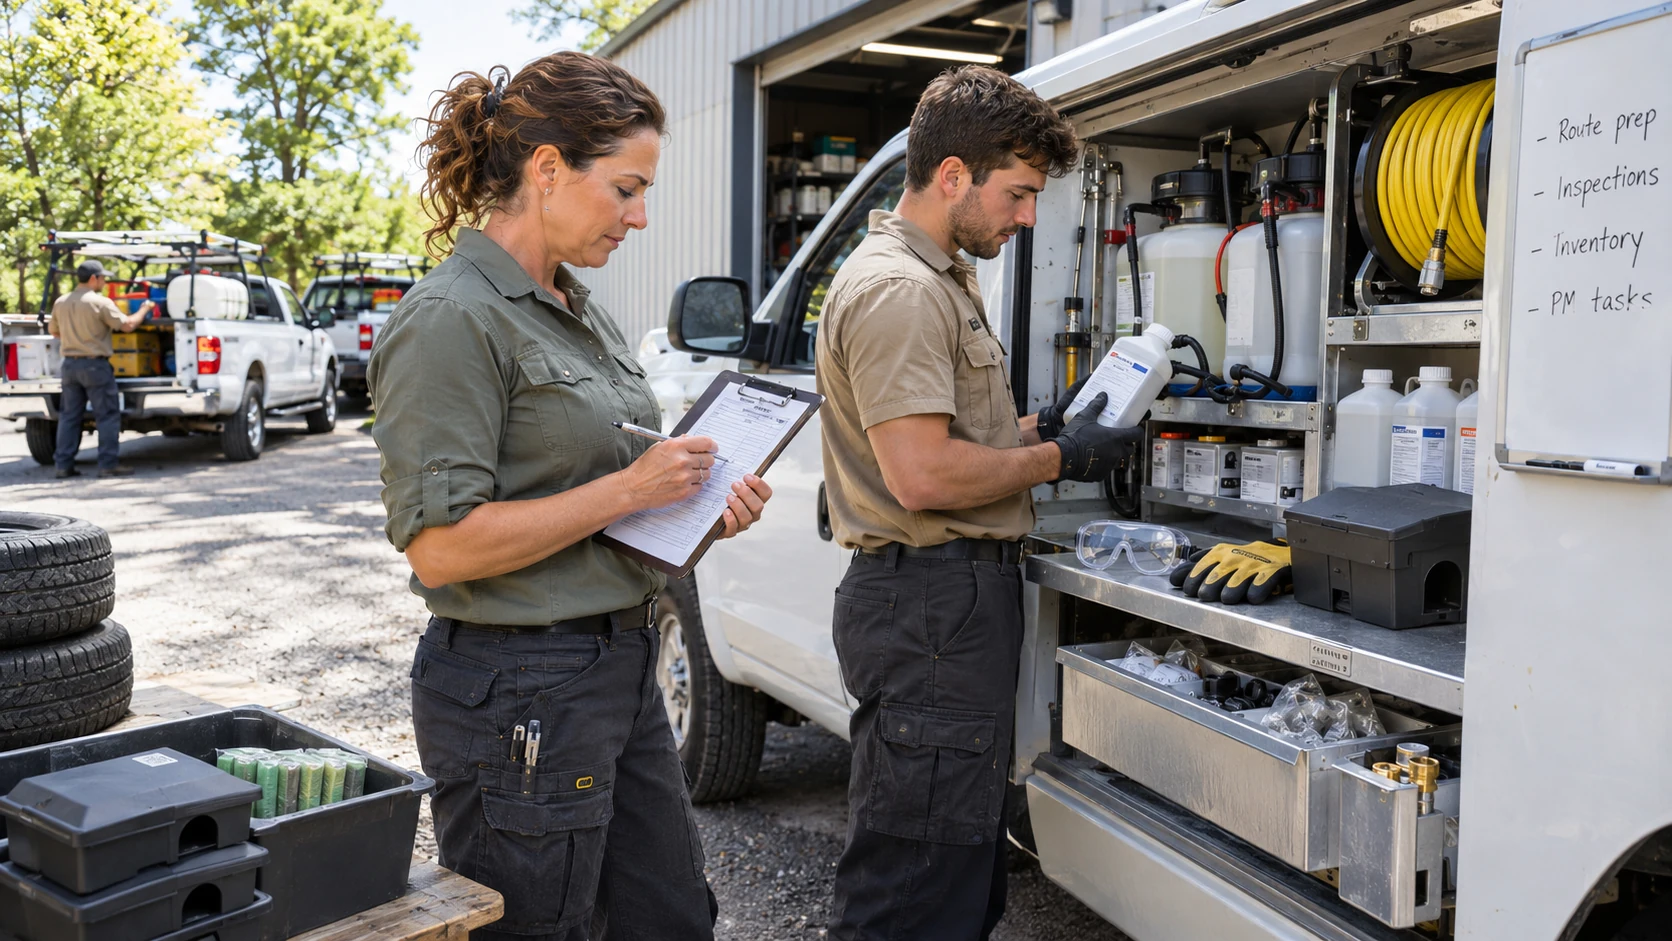
Pest control fleet management must cover both the vehicle and the application equipment it carries. A mechanically sound truck cannot complete its assigned services if its sprayer or pump fails.
Create individual asset records for equipment such as:
- Power sprayers and pumps
- Chemical storage tanks
- Hose reels and fittings
- Backpack sprayers
- Termite treatment rigs
Use equipment maintenance management software to maintain separate equipment service schedules, repair records, and inspection histories.
Technicians should also monitor the following before leaving for their routes:
- Operating pressure and calibration records
- Tank, hose, and connection leaks
- Available chemical inventory
- Equipment mounting and load security
- Product storage temperatures
Excessive heat or freezing temperatures inside parked vehicles can affect certain pesticide formulations. Follow the storage conditions specified on each product label and avoid leaving temperature sensitive products in vehicles unnecessarily.
Compliance Records a Pest Control Fleet Must Be Able to Produce
Pest control fleet managers should maintain accessible vehicle, technician, and chemical safety records to support regulatory inspections, insurance claims, and incident investigations.
Maintain the following records as applicable to your operations:
- State pesticide applicator licenses and renewal dates
- Pesticide product labels and safety data sheets (SDS)
- Vehicle registrations and insurance documents
- Vehicle and equipment inspection records
- Maintenance and repair histories
- Gross vehicle weight ratings (GVWR)
The EPA pesticide applicator certification requirements establish federal certification standards for individuals applying or supervising the application of restricted use pesticides. State licensing requirements may extend beyond these standards.
Keeping licenses, insurance policies, and inspection documents within a centralized vehicle document management system helps managers monitor expiration dates and retrieve records when needed.
Larger pest control trucks may also fall under federal commercial vehicle regulations. According to FMCSA registration requirements, vehicles operating in interstate commerce can qualify based on applicable vehicle weight ratings or actual weights of 10,001 pounds or more. Certain hazardous material transportation activities and state regulations may introduce additional obligations.
How Peak Season Changes What You Track
During peak pest control season, fleet management priorities should shift toward vehicle readiness, equipment reliability, and preventing service interruptions.
Before spring and summer demand increases, managers should prioritize:
- Completing scheduled vehicle and equipment inspections
- Replacing worn tires and brake components as needed
- Stocking frequently required replacement parts
- Establishing a vehicle availability target based on route demand
- Preparing backup vehicles and application equipment
- Monitoring deferred maintenance throughout peak season
Postponing necessary repairs to accommodate more appointments can create a maintenance backlog that becomes increasingly expensive to resolve.
Turning Tracking Data Into Repair or Replace Decisions
Fleet tracking data becomes valuable when managers use it to identify expensive vehicles, improve route profitability, and make informed replacement decisions.
Consider an older pest control van with the following illustrative annual figures.
| Financial Indicator | Amount |
|---|---|
| Maintenance and repairs | $5,500 |
| Downtime costs excluding repairs | $3,500 |
| Total annual maintenance and downtime cost | $9,000 |
| Current vehicle market value | $12,000 |
| Potential annual replacement payments | $8,400 |
These figures justify evaluating replacement, although managers should also consider financing, depreciation, insurance, equipment installation, and expected future repair expenses.
Maintaining complete vehicle service history records helps managers identify recurring failures and distinguish an isolated expensive repair from a pattern of declining reliability.
Pair vehicle cost per stop with revenue per stop to identify routes where transportation expenses are reducing service profitability.
A centralized platform like AUTOsist allows pest control managers to maintain vehicle and equipment records together instead of relying on scattered spreadsheets, paper inspection forms, and receipts.
Frequently Asked Questions
-
How do you calculate fleet cost per stop in pest control?
Add fuel, maintenance, depreciation, and insurance expenses, then divide the total by the number of completed service stops. Track technician labor and chemical expenses separately when calculating overall service profitability. -
How many stops should a pest control technician complete per day?
A technician may complete 10 to 20 routine stops daily, depending on travel distance, treatment complexity, and service duration. Managers should prioritize route density and service quality rather than appointment volume alone. -
How can pest control companies reduce fleet fuel costs?
Group customer appointments geographically, monitor excessive idling, track fuel consumption per route, maintain proper tire pressure, and limit unauthorized vehicle use. -
What should managers track when pest control technicians take vehicles home?
Track after hours mileage, fuel purchases, unauthorized trips, vehicle condition, and secure equipment and pesticide storage. Establish a written vehicle usage policy that defines technician responsibilities. -
How often should pest control trucks and sprayers receive maintenance?
Inspect vehicles and application equipment daily. Follow manufacturer recommended maintenance intervals for vehicles, pumps, tanks, and sprayers. Complete additional preventive maintenance before peak season.