 Miya Bholat
Nov 12, 2026
Truck Tire Pressure: What Fleet Managers Should Track
Truck fleet managers should track each tire's cold pressure against its load target, dual tire mismatch, repeat air loss, severe deviations and repair response times. Linking those records to fleet safety compliance can prevent costly road calls and violations.
Key Takeaways
- Tires are a leading roadside failure: They ranked second among vehicle out of service violations during CVSA's 2026 International Roadcheck.
- Cold load pressure governs: Use the tire maker's load and inflation table, not the maximum psi on the sidewall, to set targets.
- Seven metrics reveal patterns: Measure compliance, dual mismatch, air added, severe deficits, alert delays, related failures and gauge calibration.
- Ten psi low costs money: A representative scenario indicates roughly $491 to $1,082 per truck annually in added fuel and tire expense.
- Four tiers support decisions: Set documented thresholds for logging, inflation, repairs and holding a truck from dispatch.
Why Truck Tire Pressure Is a Tracking Problem, Not a Gauge Problem
Checking pressure shows today's condition. Tracking by wheel position reveals repeat losses.
During CVSA's 2026 International Roadcheck, inspectors recorded 2,914 tire out of service violations, 20.9% of all vehicle out of service violations, second only to brake systems. NACFE's 2020 report found only 46% of tractor tires and 38% of trailer tires within 5 psi of target.
For trucking and logistics fleets, records must follow tractors, trailers and wheel positions across driver changes.
What the Rules Require: 393.75(i) vs the CVSA Flat Tire Threshold
Federal rules govern inflation for the load; CVSA criteria identify certain out of service defects.
Cold Pressure for the Load, Not the Sidewall Maximum
49 CFR 393.75(i) prohibits operation below the cold pressure required for the carried load. Use axle loads and manufacturer load and inflation tables to set targets by position, not the sidewall maximum.
For tires rated above 4,000 pounds after averaging 41 to 55 mph in the previous hour, the regulation requires subtracting 15 psi from a hot reading to estimate cold pressure. Do not apply this correction in other conditions.
When a Tire Becomes Out of Service at Roadside
CVSA defines a flat tire as 50% or less of sidewall maximum, so a 120 psi maximum means 60 psi or less. Audible or felt leaks also count, subject to the limited ATIS exception.
CVSA's April 2024 update allowed certain nonsteer tread punctures with working automatic tire inflation if pressure stays above 50%. Its 2025 criteria still treat sidewall leaks as out of service regardless of ATIS.
| Standard | What It Says | What Your Fleet Should Record |
|---|---|---|
| 49 CFR 393.75(i) | Cold pressure must support the carried load | Target, axle load, cold reading |
| Heat correction | Specific recent driving conditions require a correction | Speed, tire rating, measured and estimated cold psi |
| CVSA flat tire | At or below 50% of sidewall maximum | Sidewall maximum and actual psi |
| Audible or felt leak | May trigger an out of service condition | Leak location, severity and repair |
| ATIS tread exception | Certain nonsteer tread leaks may qualify if pressure stays above 50% | ATIS status, tire position and maintained psi |
7 Tire Pressure Metrics Fleet Managers Should Track
Review seven metrics weekly to find recurring defects.
Cold Pressure Compliance Rate by Wheel Position
Divide tires within 5 psi of cold target by tires checked, then multiply by 100. Split steer, drive and trailer results. NACFE's 2020 benchmark was 46% for tractor and 38% for trailer tires; the FMCSA 2005 federal baseline was 44.15% across tires. Low rates suggest poor follow through.
Dual Assembly Mismatch
Divide dual pairs differing by more than 5 psi by pairs inspected. FMCSA's 2005 baseline found about 20% of tractor duals and 25% of trailer duals mismatched. The firmer tire carries more load while the softer tire wears faster.
Persistent uneven wear may also involve bad alignment symptoms.
Air Added per Check and Repeat Leakers
Log psi added, date and wheel position. Flag three or more inflations within 30 days for diagnosis of the valve, bead, wheel, casing or puncture. This is a suggested internal trigger.
Severe Underinflation Count
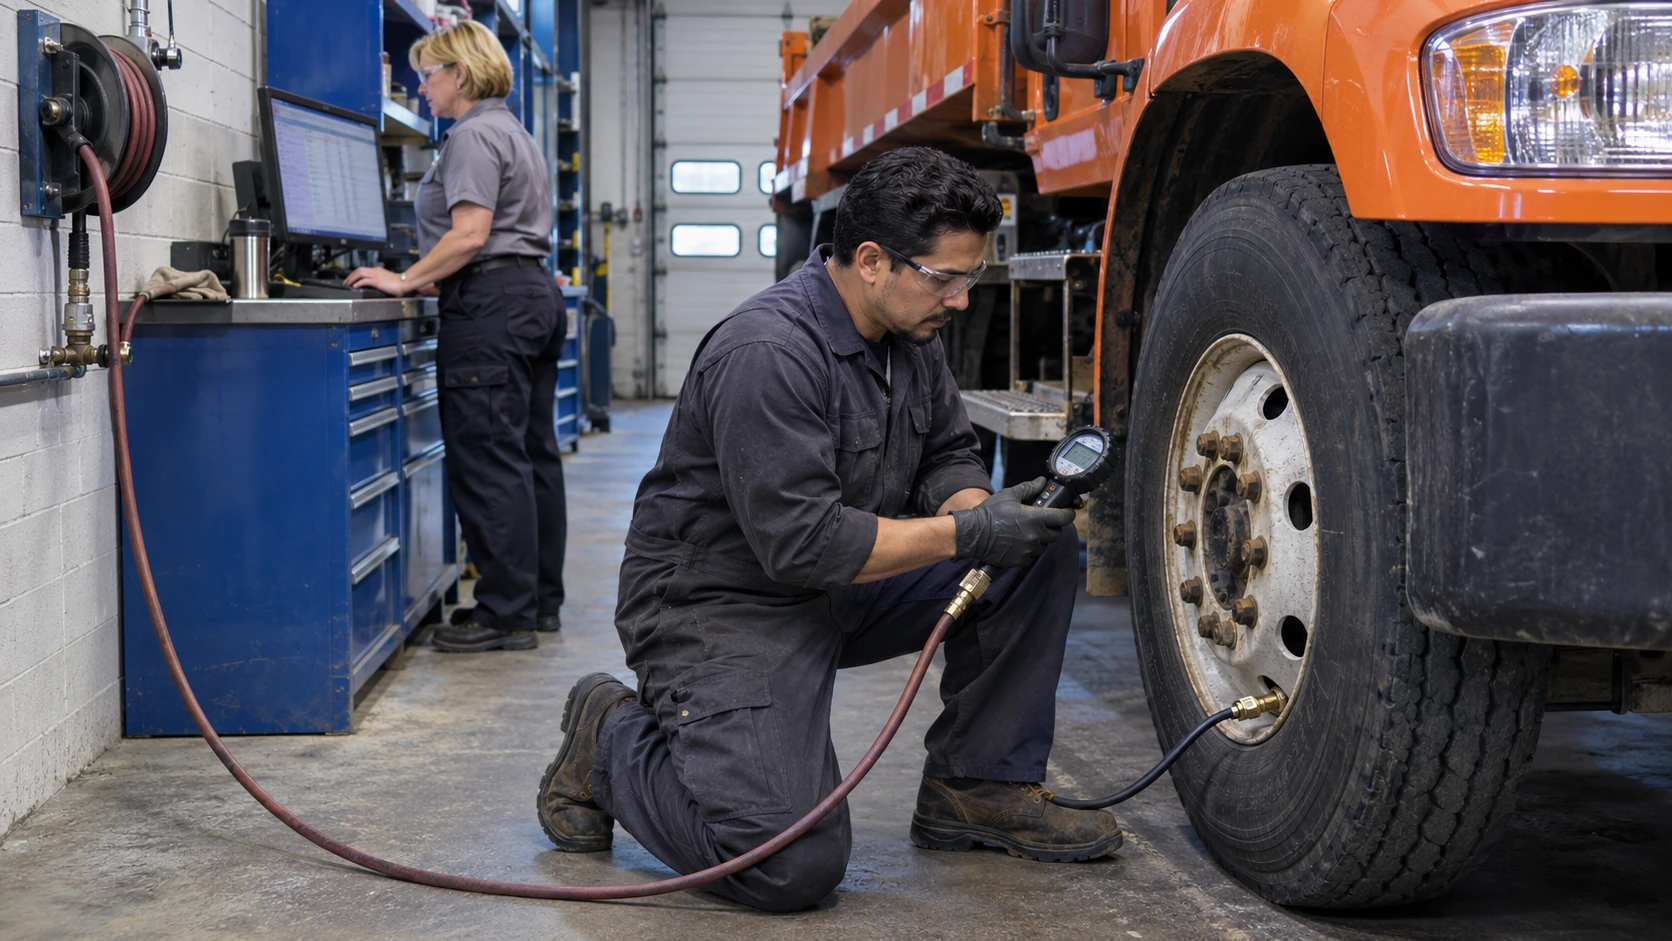
Count tires 20 psi or more below cold target. FMCSA's 2005 baseline found 7.08% overall, with 19.07% of tractor tires in fleets of 50 or fewer power units versus 2.06% in fleets over 3,000. Treat these as historical benchmarks.
Temperature Outliers and Alert Response Time
With TPMS, compare temperatures on the same axle and record hours from alert to correction. Heat can indicate underinflation, brake drag or a bearing fault.
Pressure Linked Wear, Road Calls and Roadside Violations
Compare pressure records with wear, road calls and violations. FMCSA's 2005 analysis estimated improper inflation caused about one road call per tractor trailer annually. Track DOT tire tread depth rules separately.
Gauge Calibration Log
Record gauge IDs, calibration dates and failed tests to avoid misleading readings.
Use this weekly dashboard checklist:
- Cold pressure compliance by wheel position
- Dual pair mismatch rate
- Psi added and repeat leakers
- Severe underinflation count
- Temperature outliers and alert response hours
- Pressure linked wear, road calls and violations
- Gauge calibration status
What Running 10 PSI Low Costs Per Truck: A Worked Example
Small pressure losses compound into large fleet costs. Assume 100,000 miles annually per truck, purely for illustration.
The ATRI 2026 cost report, using 2025 data, gives approximately $0.482 fuel and $0.05 tires per mile. NACFE's 2020 report estimated 0.5% to 1.0% more fuel when all tires run 10 psi low and 5% to 12% faster wear on an individual tire 10 psi low. Applying that wear range to tire spending is an illustrative proxy.
| Cost component | Calculation | Estimated annual effect |
|---|---|---|
| Base fuel | 100,000 × $0.482 | $48,200 |
| Fuel penalty | $48,200 × 0.5% to 1.0% | $241 to $482 |
| Base tires | 100,000 × $0.05 | $5,000 |
| Tire wear proxy | $5,000 × 5% to 12% | $250 to $600 |
| Combined extra cost | Fuel plus tire effect | $491 to $1,082 |
| 50 truck fleet | Combined extra cost × 50 | $24,550 to $54,100 |
Excluding downtime and violations, this resembles NACFE's 2020 projection of $750 to over $1,000 annual savings per vehicle. Substitute your actual mileage and fleet tire cost per mile.
How to Set Tire Pressure Thresholds: A Four Tier Triage Model
Thresholds turn readings into actions. Apply the highest qualifying tier without overriding legal or manufacturer requirements.
| Tier | Reading | Action |
|---|---|---|
| Green | Within 5 psi of cold target and duals within 5 psi | Record reading, no correction needed if load requirement is satisfied |
| Yellow | More than 5 to 10 psi low, or duals differ by more than 5 psi | Correct before dispatch and log air added |
| Orange | More than 10 psi low, or air needed 3 times in 30 days | Open work order and inspect tire, valve, bead and wheel |
| Red | At or below 50% of sidewall maximum, disqualifying leak, or 20 psi or more below target | Hold dispatch and have a qualified technician inspect before service |
These are suggested fleet policies, not regulatory categories. The 20 psi red trigger is internal, not automatically a CVSA out of service condition. A tire can violate the federal load pressure rule before reaching CVSA's flat tire threshold.
Manual Checks, TPMS or Automatic Inflation: Choosing Your Data Source
Choose the method based on data captured and response workload.
| Method | Data Available | Main Limitation |
|---|---|---|
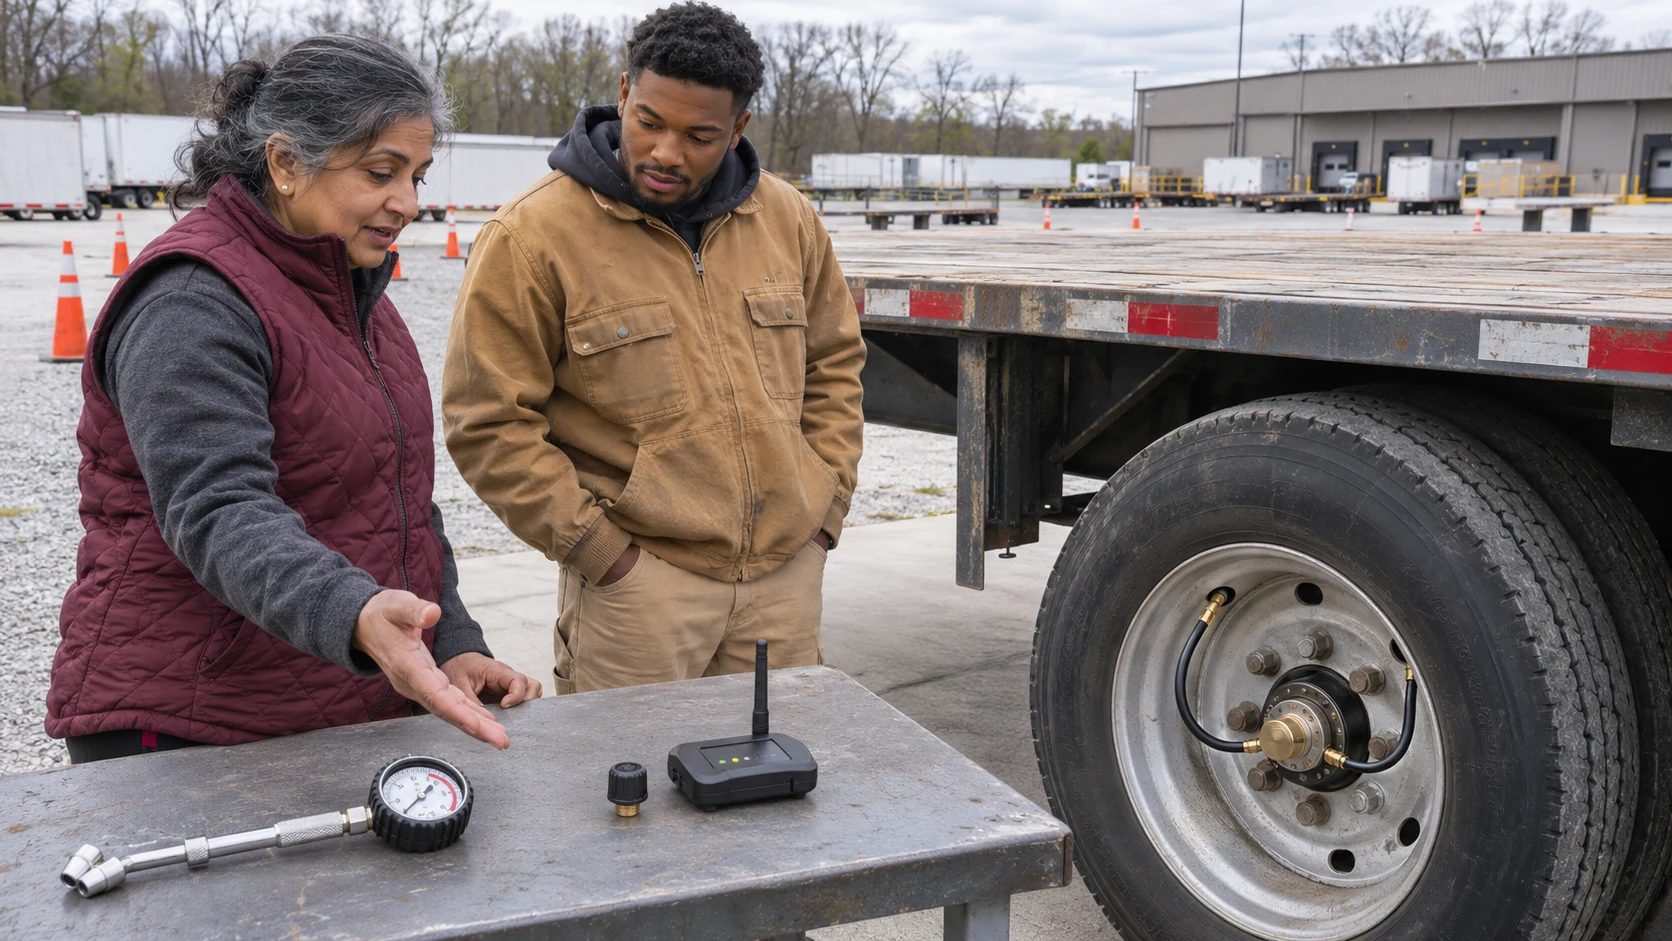
| Manual gauge | Point in time psi by position | Only useful when readings are logged consistently |
| TPMS | Ongoing tire pressure and often temperature alerts | Alerts require assigned response and closure |
| ATIS | Automatic air addition, often for trailer tires | A repeating leak can be hidden without inflation activity records |
Record manual readings and defects through a digital vehicle inspection app linked to vehicle history.
FMCSA's 2005 analysis estimated systems at approximately $1,000 per tractor trailer could repay in 1 to 2 years. NACFE's 2020 range was under one year to about three years. Verify against your fleet.
Before choosing a method, ask:
- Will it identify the exact wheel position?
- Can we see previous readings and repeated air additions?
- Who receives alerts and confirms repairs?
- Can we audit missing readings and unresolved defects?
How to Build a Tire Pressure Tracking Workflow
Put pressure history inside inspections and maintenance, with clear repair ownership.
Connect repeat findings to preventive maintenance schedules. A named owner should confirm repairs with a new cold reading.
Set a weekly exception review for repeat trailer defects and overdue corrections.
Use fleet reports and dashboards to compare trends across assets. AUTOsist can connect inspection, work order and reporting records.
Look for these outcomes in weekly reviews:
- Fewer repeated air additions without a repair
- Faster closure of severe low pressure findings
- Better evidence behind tire and maintenance spending
Frequently Asked Questions
-
How often should you check semi-truck tire pressure with a gauge?
Michelin recommends checking all tires cold at least weekly and before long trips. Include both tires in each dual pair. -
Should I let air out if a truck tire reads high after driving?
No. Pressure normally rises as tires warm up. Let the tire cool, then recheck it against the cold target. -
Should steer, drive, and trailer tires all run at the same PSI?
Use measured axle loads and the tire maker’s load and inflation tables. Select the single or dual rating for each position. Targets can differ by axle. -
What if one truck tire keeps losing air but the others hold pressure?
Log the PSI loss by wheel position and have a tire technician check the valve, bead, wheel, and tread for leaks. -
Do we still need manual pressure checks if we have TPMS?
Yes. Keep scheduled cold gauge checks and use TPMS alerts to flag pressure changes between checks.