Miya Bholat
Sep 25, 2026
Construction Equipment Cost Per Hour Explained
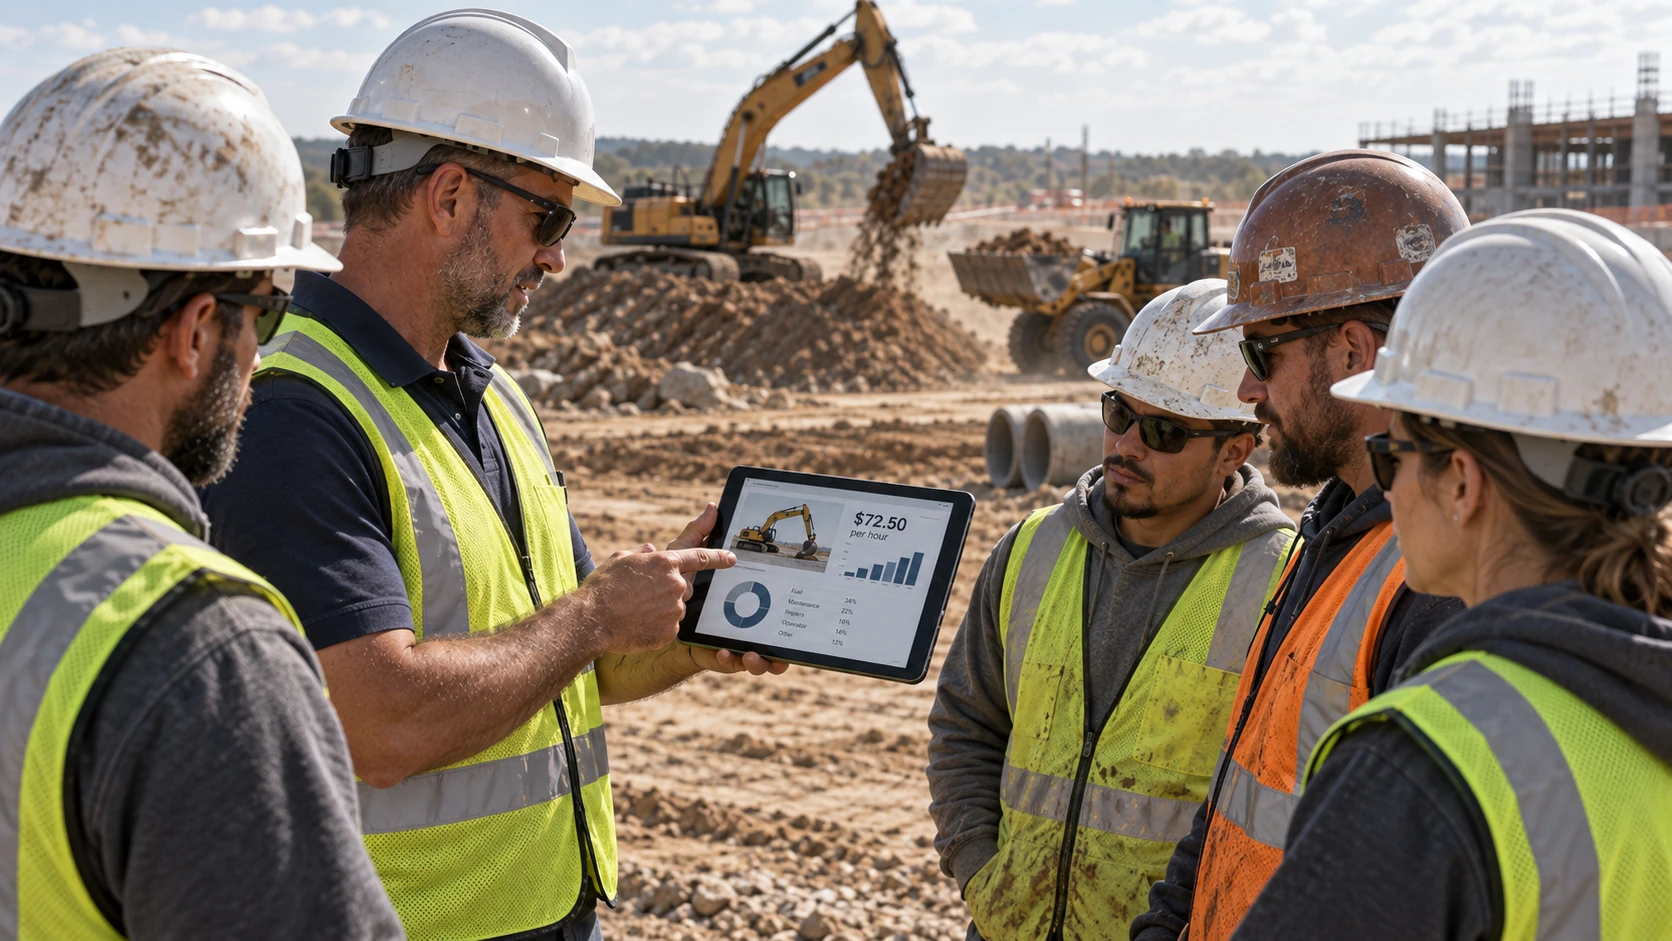
Construction equipment cost per hour is the total ownership and operating cost of a machine divided by the hours it actually works. That number tells you the minimum hourly cost you need to recover before a job starts producing margin. For contractors managing multiple assets, accurate construction fleet management records make the difference between bidding from real machine economics and bidding from memory.
Key Takeaways
- Cost per hour is your break even equipment cost. Your customer rate still needs overhead and profit added on top.
- The formula is simple, but the inputs are not. Ownership costs, operating costs, and real usage hours determine whether the result is useful.
- Estimated engine hours usually make the rate look cheaper than it is. Actual machine hours give you a more defensible denominator.
- Idle equipment still costs money. Fixed costs continue while productive hours disappear.
- Own versus rent should come from utilization. Machines with steady annual use are stronger ownership candidates than specialized assets that sit for long periods.
What Cost Per Hour Actually Tells You
Cost per hour tells you what one machine really costs for each hour of use after you account for both owning it and operating it. A guessed rate might cover fuel and an operator but quietly miss depreciation, insurance, repairs, storage, and capital cost.
That matters because a rate can look profitable while the equipment is actually consuming the margin. A proper fleet cost and expense analysis helps separate what a machine costs from what you happen to invoice for it.
The Formula, and the Three Inputs Fleets Get Wrong
The basic calculation is:
Cost Per Hour = (Total Ownership Costs + Total Operating Costs) / Usage Hours
The U.S. Army Corps of Engineers uses a structured ownership and operating expense approach in EP 1110 1 8 for developing hourly equipment rates used in construction estimating. The arithmetic is rarely the problem. The inputs are.
Ownership Costs (the fixed side)
Ownership costs keep accumulating whether the machine works today or stays parked.
Include the fixed side before calculating your rate:
- Depreciation based on purchase price and expected salvage value
- Financing or cost of capital
- Equipment insurance
- Taxes and registration where applicable
- Storage, yard, and security costs
Insurance is often budgeted as a percentage of insured equipment value, but actual premiums vary widely by machine, coverage, location, and claims history. Looking at vehicle total cost of ownership separately from daily operating spend helps keep those fixed costs visible.
Operating Costs (the variable side)
Operating costs rise as the machine works.
Track these expenses by asset:
- Fuel
- Preventive maintenance
- Repairs
- Fluids and filters
- Tires or undercarriage
- Operator labor
Fuel burn should come from actual records when possible. Manufacturer data can provide a starting benchmark, but workload, operator behavior, idle time, terrain, and attachment use change consumption. Caterpillar, for example, notes that fuel use varies with operating conditions and that idle time can add meaningful fuel cost.
Consistent preventive maintenance scheduling also makes repair and service costs easier to assign to the machine that created them.
Usage Hours (the number everyone estimates)
This is where a lot of hourly calculations break.
If you assume a backhoe will run 1,200 hours but it actually records 750 productive engine hours, the denominator is too large and your calculated hourly cost looks artificially low. Real engine hours beat annual guesses.
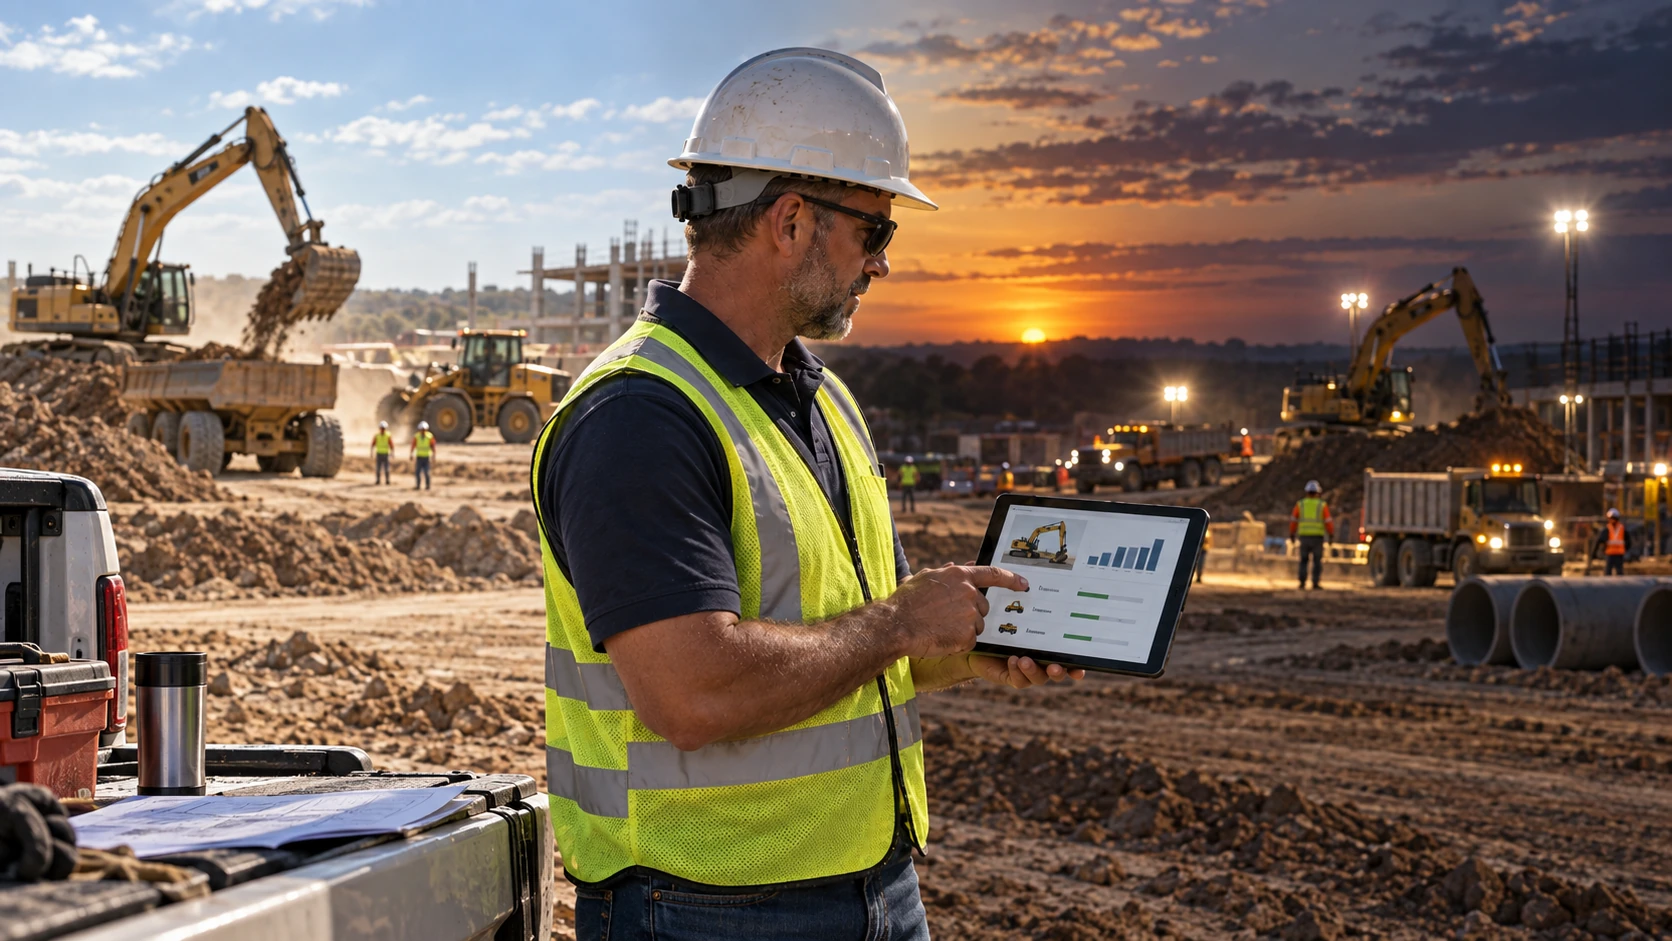
Tracking hours through equipment maintenance management gives you a stronger base for both maintenance timing and hourly costing.
A Worked Example, Costing a Backhoe Loader by the Hour
Here is a simplified example you can copy and replace with your own numbers.
- Start with purchase and salvage value. Purchase price is $120,000 and expected resale value after six years is $30,000.
- Calculate annual depreciation. $120,000 minus $30,000 equals $90,000. Divide by six years for $15,000 per year.
- Add other ownership costs. Assume $6,000 for capital cost, $2,400 for insurance, and $3,600 for taxes, storage, and related fixed costs. Annual ownership cost becomes $27,000.
- Calculate hourly operating cost. Fuel costs $16 per hour, maintenance and repairs $12, fluids and wear items $5, and loaded operator labor $38. Operating cost is $71 per hour.
- Use actual annual hours. Assume the backhoe records 900 hours.
- Calculate annual operating cost. $71 multiplied by 900 equals $63,900.
- Calculate total cost per hour. $27,000 plus $63,900 equals $90,900. Divide by 900 hours and the result is $101 per hour.
For context, the U.S. Bureau of Labor Statistics reported a May 2025 median wage of $28.66 per hour for construction equipment operators before employer taxes, benefits, and other labor burden.
Use this result inside your fleet budget planning process rather than carrying the same assumed machine rate from one year to the next.
Typical Cost Per Hour Ranges by Equipment Class
These are broad planning ranges, not quotes. Region, machine size, financing, fuel, annual utilization, attachments, and operator cost can push the real number outside them.
| Equipment Class | Typical Cost Per Hour (machine only) | Typical Rate With Operator | Notes |
|---|---|---|---|
| Mini excavator | $45 to $80 | $95 to $145 | Size and attachments matter |
| Standard excavator | $100 to $190 | $150 to $280 | Fuel and undercarriage are major drivers |
| Backhoe loader | $65 to $115 | $115 to $190 | Utilization strongly affects ownership cost |
| Skid steer | $45 to $85 | $95 to $160 | Attachments can materially change cost |
| Wheel loader | $85 to $170 | $140 to $250 | Fuel burn rises quickly with size |
| Dozer | $105 to $220 | $160 to $320 | Undercarriage and application matter |
Why Idle Time Inflates Your Cost Per Hour
Fixed ownership costs do not disappear when the machine stops producing. Suppose annual fixed cost is $30,000. At 1,200 hours, that equals $25 per hour. At 600 hours, the same $30,000 becomes $50 per hour before fuel, repairs, or labor enter the calculation.
That is why idle assets increase fleet costs even when their fuel use looks modest.
Downtime creates a similar problem. The machine loses productive hours while depreciation, insurance, financing, and often labor costs continue. Calculating the cost of equipment downtime helps turn an availability problem into a dollar figure.
AUTOsist can bring engine hours and per asset expenses into the same record so managers can see which machines carry high cost but low productive use.
Own, Rent, or Lease, Using Cost Per Hour to Decide
Do not make this decision from purchase price alone. Compare expected annual hours, ownership cost per hour, rental rates, transport charges, financing, maintenance responsibility, and how long you expect to need the machine.
As a screening rule, ownership often becomes more attractive around 600 to 750 hours per year when that utilization stays consistent for several years. Renting usually deserves a closer look below roughly 500 annual hours or when utilization stays below about 40 percent.
The middle is where your own records matter. Specialized machines can still favor renting even when the simple hourly math leans toward ownership because you avoid long periods of storage, depreciation, repair exposure, and capital tied up in an asset with uncertain future work.
How to Build a Cost Per Hour You Can Bid With
Use the same process for every machine so your bids rely on comparable numbers.
- List every ownership cost. Include depreciation, financing, insurance, taxes, storage, and capital cost.
- Record operating costs by machine. Track fuel, service, repairs, parts, wear items, and labor.
- Use actual engine hours. Do not substitute a planned annual utilization number for recorded hours.
- Review maintenance records. Use maintenance work orders to connect repair spending with the asset that caused it.
- Recalculate the rate regularly. Fuel, wages, repairs, utilization, and financing costs change.
- Add overhead and profit after break even. Cost per hour tells you what the machine costs you. It does not tell you what the customer should pay.
A fleet reports dashboard can make that review easier when expense and utilization records are already assigned by asset.
The final goal is simple: track fleet costs without guesswork so the hourly figure used in a bid reflects the machine you actually operate, not an industry average.
Frequently Asked Questions
-
Should I use engine hours or productive hours to calculate equipment cost per hour?
Use actual engine hour records, but separate productive time from idle time. For bidding and cost recovery, realistic productive or billable hours give you a safer denominator than estimated annual hours. -
Should operator wages be included in equipment cost per hour?
Include operator labor if you want an all in job cost. If you track a machine only rate, keep operator labor separate and add it when building the bid so you do not count it twice. -
How often should I recalculate equipment cost per hour?
Review the rate at least annually and whenever fuel, insurance, repairs, financing, or utilization changes materially. A major repair or a sharp drop in machine hours can change the rate quickly. -
Should mobilization and attachments be included in the hourly equipment rate?
Usually, job specific transport and specialty attachments should be priced separately. Keeping them outside the base machine rate makes it easier to price jobs with different hauling distances and attachment needs. -
Does a paid off machine still have a cost per hour?
Yes. A paid off machine still carries depreciation or replacement cost, insurance, maintenance, repairs, storage, fuel, and other operating expenses. Treating it as free equipment will understate your actual job cost.