 Miya Bholat
Oct 30, 2026
Fleet Spend Concentration: Which Vehicles Drive Cost
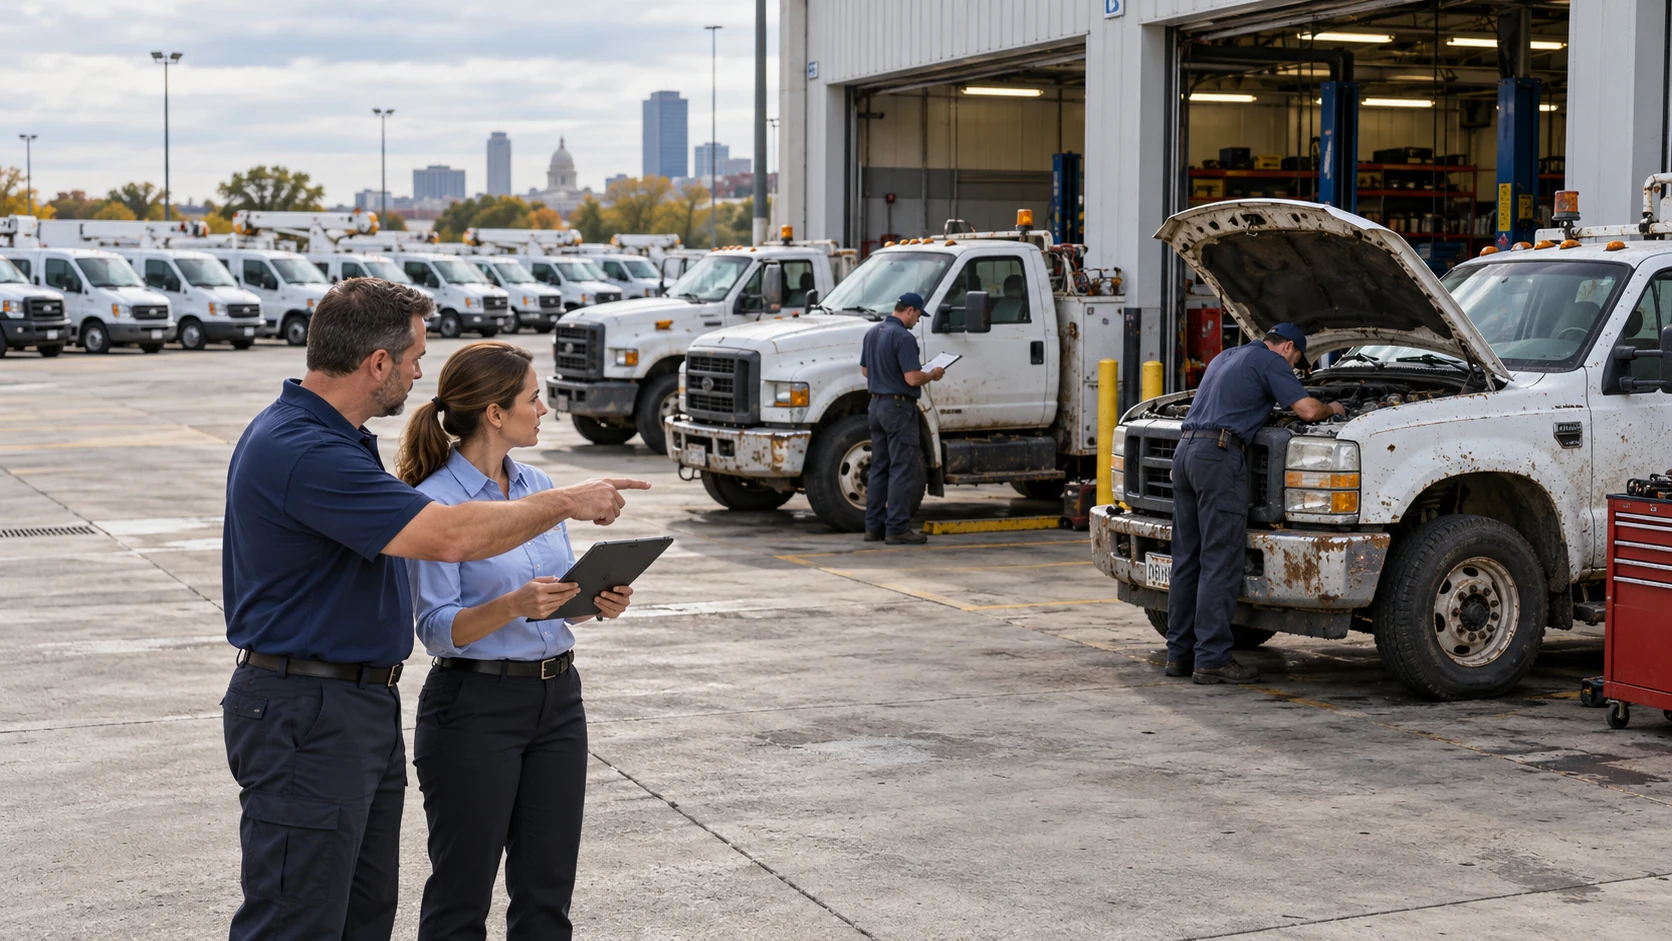
The vehicles that drive the most fleet costs are often aging assets with recurring repairs, heavily used workhorses, vehicles assigned to the wrong jobs, and units carrying deferred maintenance. You can identify their impact by ranking vehicle expenses and calculating how much of your total budget the costliest group consumes. Effective fleet cost management then connects that spending pattern to replacement, reassignment, vehicle specifications, or maintenance decisions.
This matters especially in public works related fleet management, where two trucks of the same type may face completely different demands. One handles routine transport while another supports emergency repairs, heavy loads, and seasonal operations. Their costs should reflect the work they perform, but excessive spending still needs an explanation.
Key Takeaways
- Concentration differs from a high average. It measures how much of your total spending comes from a relatively small group of vehicles.
- A few vehicles can absorb disproportionate spending. Ranking costs reveals whether budget pressure comes from individual assets or larger groups.
- The same cost drivers appear repeatedly. Age, heavy utilization, incorrect assignments, and deferred maintenance often explain concentrated expenses.
- The spending pattern determines the response. Isolated outliers, aging groups, and widespread category increases require different solutions.
- Cutting expenses blindly can make things worse. Sustainable savings come from correcting the conditions generating excessive costs.
What Fleet Spend Concentration Actually Means
Fleet spend concentration measures the percentage of total fleet expenditure attributable to a particular group of vehicles.
A fleet can have reasonable average operating costs while a handful of vehicles consume a disproportionate share of the maintenance and fuel budget.
Conversely, a fleet with consistently high costs across most vehicles may have a broad operating problem rather than concentrated spending.
The distinction matters because the solutions differ. Concentration identifies where financial pressure accumulates, while averages describe overall spending levels.
If you need to investigate individual expensive units, why average fleet costs hide expensive vehicles covers that identification process. The next question is what the distribution of those costs reveals about your fleet.
How to Measure How Concentrated Your Spend Is
Measuring fleet spend concentration starts with understanding how expenses are distributed across individual vehicles, not just how much the fleet spends overall. By comparing each vehicle's contribution to total costs, fleet managers can see whether spending is concentrated in a few assets or spread across the fleet. Two simple steps make that pattern easier to identify.

Rank Every Vehicle by Total Cost
Start with the total operating expense of each vehicle over the same reporting period.
Include fuel, maintenance, repairs, parts, insurance, ownership or lease expenses, and attributable downtime costs where reliable records exist. Use consistent accounting rules across vehicles.
Your fleet cost per vehicle calculation provides the foundation. Once you have comparable totals, rank vehicles from the highest spending unit to the lowest.
Then calculate their cumulative contribution to overall fleet spending.
Keep mileage, engine hours, vehicle class, and workload available for interpretation. High total spending alone does not establish inefficiency.
The Concentration Ratio You Can Calculate Today
The simplest concentration measure is the percentage of total expenditure generated by your costliest 10% or 20% of vehicles.
Spend Concentration Ratio (%) = (Total spending of the costliest vehicle group ÷ Total fleet spending) × 100
A healthy result is not one universal percentage. It depends on fleet composition, duty cycle, and how work gets distributed.
A concentrated result deserves closer attention when comparable vehicles perform similar work but produce sharply different spending patterns.
Use the following workflow to calculate and interpret the ratio.
How to Run a Spend Concentration Analysis
Repeat the analysis using consistent reporting periods. A rising concentration ratio can reveal developing problems before they become obvious in the annual budget.
Which Vehicles Actually Drive the Cost
Concentrated fleet spending usually follows recurring operational patterns.
The following table connects common vehicle types with the evidence managers should investigate first.
| Vehicle archetype | Why it concentrates cost | Signal to look for | First move |
|---|---|---|---|
| Aging assets | Repairs, wear, and downtime accumulate | Rising repair frequency and cost | Review replacement timing |
| High utilization workhorses | Heavy workloads increase fuel and wear | High spending relative to output | Compare duty cycles |
| Wrong spec vehicles | Equipment does not match the assignment | Excess fuel or premature wear | Reassign or change specifications |
| Deferred maintenance vehicles | Missed service creates repeat failures | Recurring faults and emergency repairs | Restore preventive maintenance |
End of Life and High Age Assets
Older vehicles often carry more frequent repair needs, higher component wear, and less predictable availability.
The American Transportation Research Institute's 2026 Analysis of the Operational Costs of Trucking reported an average operating cost of $2.336 per mile in 2025, up 3.4% from 2024. Excluding fuel, costs increased 4.2% to $1.854 per mile. Repair and maintenance rose 8.6% to approximately $0.215 per mile, roughly 45% above 2019 levels.
These are trucking industry benchmarks, not universal figures for every fleet type. They nevertheless illustrate why extending replacement cycles can increase exposure to maintenance expenses.
The key is to understand how costs change throughout ownership. The breakdown of fleet costs that change with vehicle age helps distinguish normal aging expenses from patterns that warrant earlier replacement.
High Utilization Workhorses
Some vehicles generate large expenses simply because they perform most of the fleet's work.
A delivery truck operating daily will naturally consume more fuel and maintenance resources than a backup vehicle. Its higher spending may be justified if it delivers proportionately more useful output.
The problem emerges when workload increases faster than productivity or when one vehicle absorbs assignments that could be distributed more efficiently.
Compare heavily used units with their output, duty cycle, and available alternatives. At the opposite end, understanding how idle assets increase fleet costs can reveal opportunities to redistribute work without purchasing additional vehicles.
Misassigned or Wrong Spec Vehicles
Vehicles become expensive when their capabilities do not match the work assigned to them.
An oversized truck running light local deliveries may consume unnecessary fuel. An undersized vehicle carrying demanding loads may experience excessive wear, breakdowns, and shortened component life.
Before replacing an expensive unit, investigate whether its assignment created the problem.
The principles of fleet rightsizing help managers match vehicle capacity, workload, and operating requirements.
The U.S. Department of Energy also recommends evaluating reassignment, replacement, and vehicle efficiency when rightsizing a vehicle fleet. Correcting the assignment may reduce costs without removing a useful asset.
Deferred Maintenance Snowballs
Some vehicles become expensive because small maintenance problems remain unresolved.
A delayed service, unresolved inspection defect, or repeated temporary repair can develop into a larger failure. Emergency work then disrupts planned maintenance and creates additional downtime.
This is especially concerning for regulated commercial fleets. The FMCSA maintenance guidancemaintenance guidance reinforces the importance of systematic inspection, repair, and maintenance.
Managers should investigate recurring faults, missed service intervals, and repeat work orders before assuming the vehicle itself is fundamentally unsuitable.
The reasons cheap maintenance processes become expensive later often explain why apparently minor savings create larger long term expenses.
Reading the Pattern: What the Concentration Shape Tells You
A concentration ratio tells you where spending accumulates. The distribution reveals what kind of problem you may have.
Three patterns are particularly useful.
1. A few isolated cost outliers
A small number of vehicles account for unusually high spending, while similar units remain stable.
Investigate individual repair histories, unusual assignments, accident damage, or recurring failures. The likely response is an asset specific intervention rather than a fleetwide policy change.
2. An entire aging group
Several vehicles purchased around the same period begin producing elevated maintenance and downtime costs.
This points toward a replacement sequencing problem. Prioritize the group according to operating risk, service importance, and expected future costs rather than treating every unit as an isolated failure.
3. A shared expense category across many vehicles
Fuel, tires, or repair spending rises across vehicles with different ages and operating histories.
The cause may involve operating policies, routes, vehicle specifications, procurement, or maintenance practices. Changing one vehicle will not solve a widespread pattern.
These distinctions prevent managers from confusing a costly vehicle with an expensive operating system.
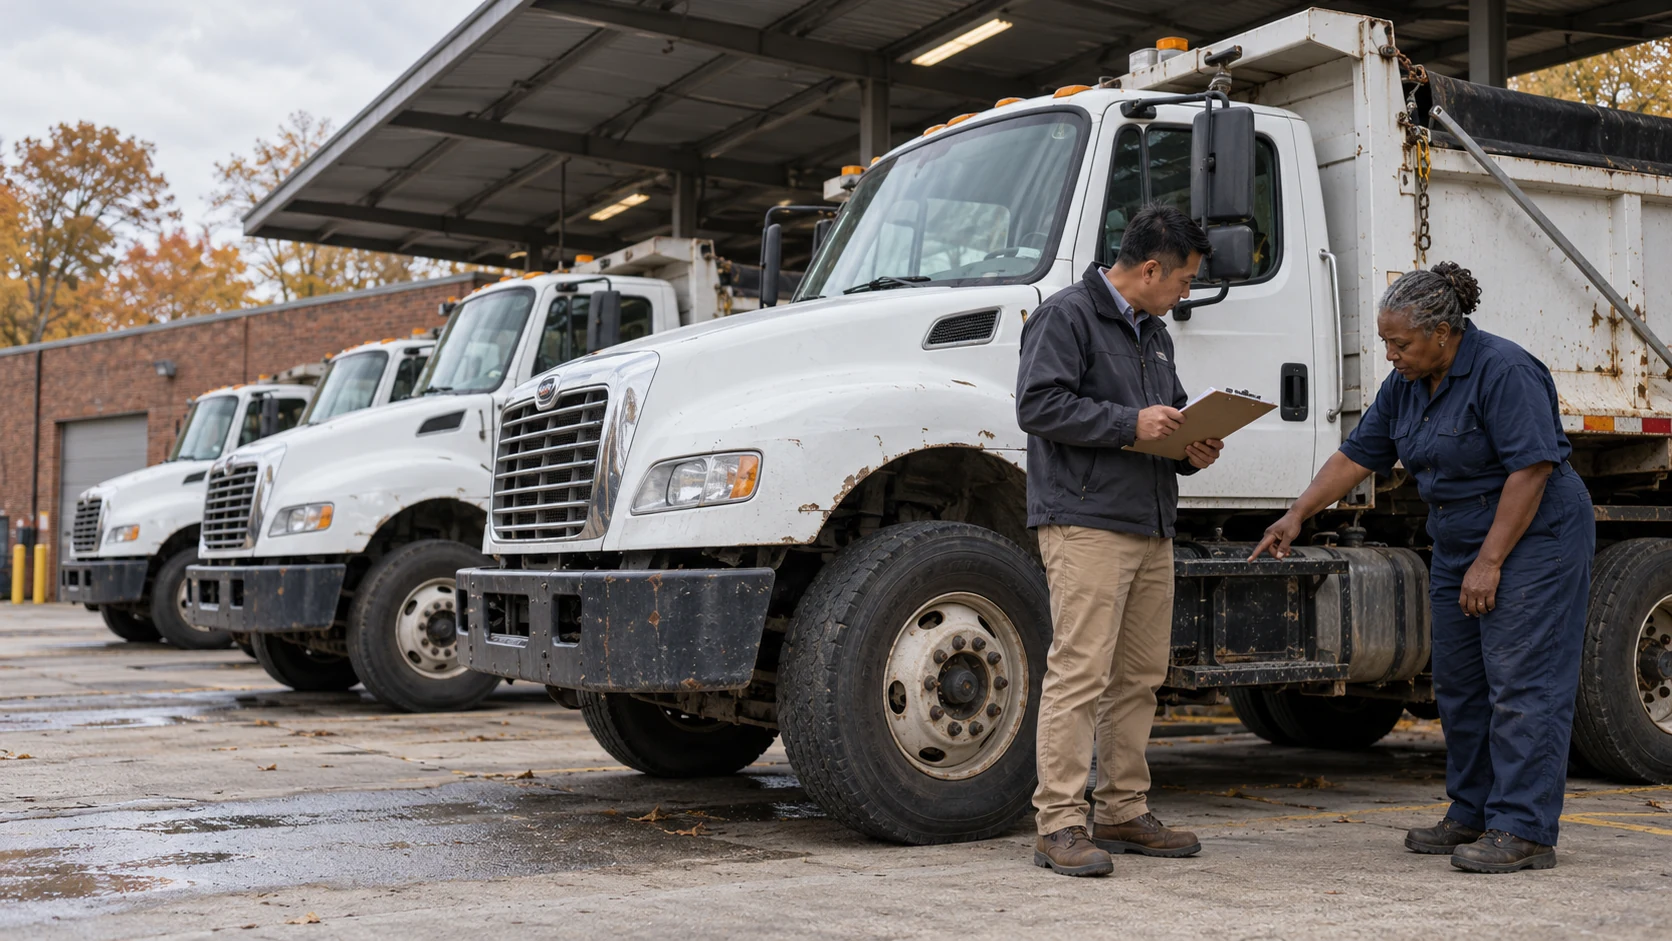
Turning Concentration Into Action Without Cutting Blind
Once you recognize the pattern, connect it to a specific operational change.
For aging groups, build a replacement sequence based on service criticality, downtime risk, and expected ownership costs.
For overloaded workhorses, consider redistributing routes or assignments.
For incorrectly specified vehicles, evaluate whether another class or configuration can perform the job more efficiently.
For recurring maintenance failures, address inspection follow through, service scheduling, and repair quality.
When an individual vehicle may no longer be economical, use a structured fleet vehicle repair versus replacement assessment rather than making the decision from one repair invoice.
Avoid cutting maintenance budgets, delaying replacements, or choosing cheaper parts without understanding the source of the expense. Those actions can reduce immediate invoices while increasing future operating costs.
The objective is not simply to lower the next month's spending. It is to change the conditions that repeatedly generate the largest costs.
How Software Makes Spend Concentration Visible
Spend concentration becomes difficult to analyze when fuel logs, repair invoices, maintenance records, and downtime information sit in separate systems.
AUTOsist helps connect these records to individual assets, giving fleet managers a more consistent foundation for comparison.
A fleet reports dashboard helps managers review operational and financial records together. Vehicle cost data can then be sorted or exported to calculate concentration shares and identify unusual patterns.
However, a ranked spending list becomes useful only when managers can investigate the reasons behind each amount.
A vehicle with several expensive repairs requires a different response from one with consistently high fuel consumption.
A consolidated vehicle service history provides context about completed maintenance and recurring issues. Associated work orders, fuel entries, and available downtime records help managers understand how those costs developed.
When the information stays connected to the vehicle, teams can review concentration regularly instead of reconstructing the same expenses during every budget cycle.
Frequently Asked Questions
-
Does the 80/20 rule apply to every fleet's spending?
No. The costliest 20% of vehicles may account for more or less than 80% of spending. Calculate your fleet's actual concentration ratio rather than assuming a fixed percentage. -
Is the vehicle with the highest spending always the least efficient?
No. Heavily used vehicles naturally cost more. Compare cost per mile, engine hour, and workload against similar vehicles before judging efficiency. -
Should vehicle downtime count toward fleet spend concentration?
Yes, when measurable. Include attributable rental expenses, overtime, and lost productivity alongside repair costs to understand the full financial impact. -
How often should fleet managers review spending concentration?
Review monthly to catch sudden increases and quarterly to identify patterns. Reassess after major workload changes or vehicle replacements. -
Should fleets replace the vehicles responsible for the highest costs?
Not automatically. Investigate usage, repair history, and vehicle assignments first. Consider replacement when projected future ownership costs justify it.