Miya Bholat
Jul 1, 2026
6 Fuel Trends That Signal a Maintenance Problem

Fuel trends signal a maintenance problem when consumption changes without a matching change in mileage, routes, loads, drivers, or fuel prices. By treating fuel data as an early diagnostic signal within a structured fleet fuel management process, fleet managers can identify inefficient vehicles, inspect the right components, and correct developing problems before they cause breakdowns.
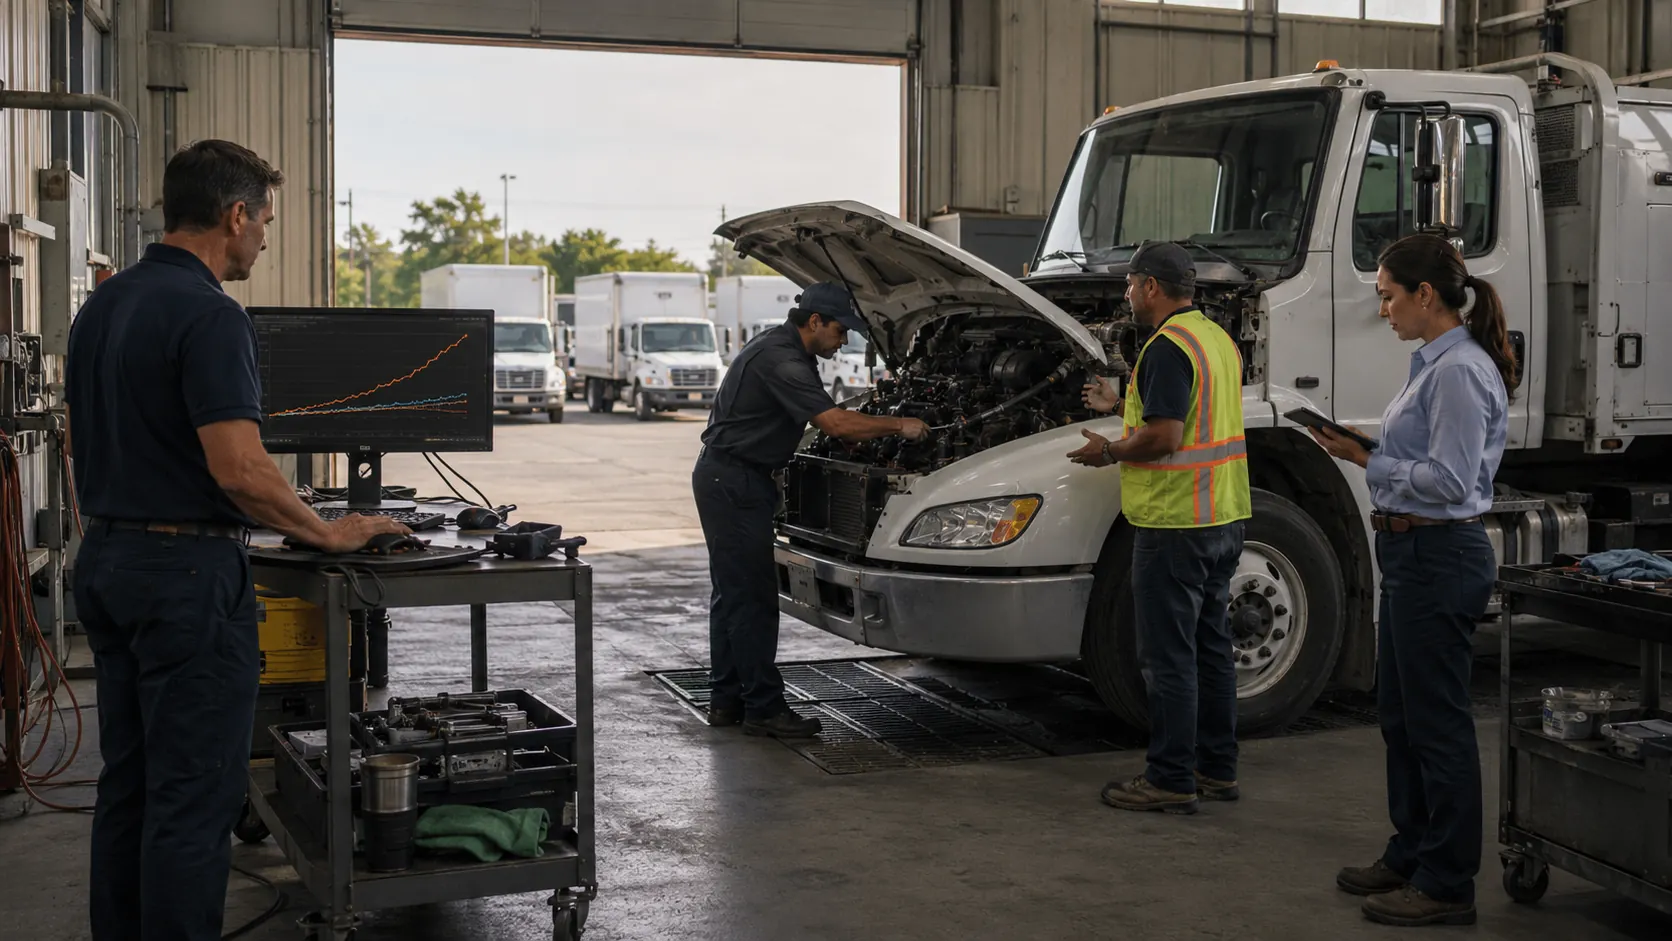
A fleet manager may see fuel costs climbing while vehicles, routes, and drivers appear unchanged. Most fleets treat fuel as an expense line, but MPG, idle use, gallons consumed, and cost per mile often change before a warning light or breakdown appears.
Key Takeaways
- Gradual MPG decline often signals a shared maintenance gap. Compare similar vehicles over 60 to 90 days to uncover missed service and tire issues.
- A sudden spike on one vehicle requires fast investigation. Check the unit against its own baseline and comparable vehicles.
- Rising idle fuel may have a mechanical cause. HVAC, charging, cooling, or shutdown faults can force longer idling.
- Fuel data should confirm that service worked. MPG that stays low after maintenance may reveal incomplete work or a missed fault.
- Erratic MPG can expose intermittent problems. Sticking brakes, thermostat faults, sensor issues, and alignment problems often create repeated swings.
- Every serious anomaly needs a maintenance response. An alert has little value unless it leads to an inspection, repair, and follow up check.
Why Fuel Data Is Your Best Early Warning System
Fuel consumption reacts to rolling resistance, combustion quality, engine load, idle time, and component condition. That makes it a leading indicator that can reveal a fault while a vehicle still completes its work.
Fuel often represents roughly 25 to 35 percent of operating costs, depending on duty cycle. Even small losses matter, so controlling fleet fuel costs requires more than watching monthly spend.
Gradual declines rarely trigger an obvious alert. This table provides a diagnostic starting point.
| Fuel trend | Data pattern | Likely maintenance direction | First response |
|---|---|---|---|
| Gradual MPG decline | Similar vehicles lose 3 to 5 percent over 60 to 90 days | PM gaps, oil, tires, intake | Review due services and common components |
| Sudden single vehicle spike | One unit rises while peers stay stable | Sensor, injector, pump, or leak | Validate data and inspect quickly |
| Rising idle fuel | Idle share grows without route changes | HVAC, charging, cooling, shutdown control | Separate driver idle from mechanical idle |
| No improvement after service | MPG remains below baseline | Incomplete work or unresolved fault | Reopen and verify the repair |
| Inconsistent route MPG | Repeated up and down swings | Brakes, thermostat, alignment, sensor | Compare trips and inspect the outlier |
| Rising spend with flat mileage | Price adjusted gallons increase | Drivetrain, tires, engine, brake drag | Calculate excess gallons and inspect |
Trend #1: Gradual MPG Decline Across Multiple Vehicles
A slow MPG decline across similar vehicles usually indicates a shared process problem. Common causes include delayed oil changes, missed tire checks, deferred service, or unsuitable PM intervals.
What This Pattern Actually Looks Like in Your Data
If service trucks fall from 10 MPG to 9.7 after 60 days and 9.5 after 90 days, investigate. Compare by class, route, load, and season because a 3 to 5 percent peer decline is more useful than a mixed fleet average.
Common Maintenance Culprits Behind Fleetwide MPG Drops
Start with items affected by the same maintenance policy or vendor. Reviewing preventive maintenance schedules can reveal whether recurring tasks are being completed at the correct mileage or engine hours.
- Incorrect oil viscosity: The wrong grade can reduce fuel economy by about 1 to 2 percent.
- Low tire pressure: Fuel economy can fall about 0.2 percent for every 1 PSI drop in average tire pressure.
- Overdue inspections: Missed pressure, alignment, lubrication, and fluid checks allow inefficiency to accumulate.
- Restricted intake: The MPG effect varies by engine, but restricted airflow still deserves inspection.
Trend #2: Sudden Fuel Spike on a Single Vehicle
When one vehicle spikes while comparable units remain stable, suspect a component fault, leak, inaccurate transaction, or unauthorized fueling event.
Mechanical Failures That Cause Sudden Fuel Spikes
Several faults can change consumption quickly while the vehicle still feels drivable. Check these areas first.
- Faulty oxygen sensor: A severe failure can reduce fuel economy by as much as 40 percent in some gasoline vehicles.
- Fuel injectors: Clogging or poor spray patterns can disrupt combustion.
- Fuel pump or pressure control: Incorrect pressure can reduce efficiency and performance.
- Fuel lines and connections: Any suspected leak requires immediate safety inspection.
How to Isolate the Problem Vehicle Quickly
Compare the unit with its 30 to 90 day baseline and with peers on similar routes. Then use fleet fuel management software to confirm gallons, odometer readings, transactions, and cost per mile before assigning shop work.
Trend #3: Rising Idle Fuel Consumption
Idle fuel may rise because of waiting or because HVAC, charging, cooling, restart, or automatic shutdown problems encourage extended idling.
A heavy truck using about 0.8 gallon per idle hour can consume roughly 24 gallons from one hour of daily idling over a 30 day month. Across ten trucks, that becomes about 240 gallons, making idle analysis especially valuable in trucking and logistics fleet operations.
Separate the causes before assigning responsibility.
- Driver caused idle: Break habits, paperwork, loading delays, or unnecessary warmup.
- Mechanical caused idle: Weak cab cooling, battery concerns, shutdown faults, or restart problems.
- Job required idle: Power takeoff use, emergency equipment, or worksite power needs.
Trend #4: Fuel Consumption Does Not Improve After a Service
If MPG remains below baseline after service, an incorrect fluid, incomplete inspection, missed fault code, or deeper issue may remain. Do not close the case only because the work order shows completion because fuel performance provides an objective result.
Using Post Service Fuel Data as a Quality Check
Compare several complete fueling cycles before and after service while controlling for route, load, weather, and idle time. A complete vehicle service history helps connect repeated anomalies with earlier repairs.
Use four checks after relevant maintenance.
- Record the baseline: Use several fueling cycles before service.
- Define the expected result: State whether MPG or idle use should improve.
- Review new data: Avoid judging the repair from one trip.
- Reopen unresolved work: Investigate when performance stays outside the normal range.
Trend #5: Inconsistent MPG on the Same Route
Erratic MPG on the same route often points to an intermittent fault. Sticking brakes, thermostat problems, sensor faults, or changing tire resistance can make one trip efficient and the next wasteful.

Severe misalignment can increase fuel consumption by 10 percent or more, although the effect depends on how far the wheels are outside specification. Use GPS tracking and telematics data to confirm that route, speed, stops, and trip time remained comparable before blaming the vehicle.
Trend #6: Fuel Costs Rising While Mileage Stays Flat
When spend rises but mileage stays stable, adjust for price per gallon. If gallons and price adjusted cost per mile still increase, the fleet has an efficiency gap that supports action to reduce fleet fuel costs.
Calculating the Real Cost Gap
Consider a 20 truck fleet traveling 40,000 miles per month. At 8 MPG, it uses 5,000 gallons. At 7.5 MPG, it uses about 5,333 gallons.
That decline adds roughly 333 gallons per month. At $4 per gallon, the added cost is about $1,333 per month, or nearly $16,000 per year.
Fuel gap formula
Expected gallons = Total miles ÷ Baseline MPG
Actual gallons = Total miles ÷ Current MPG
Excess gallons = Actual gallons minus Expected gallons
Where the Hidden Waste Usually Lives
After controlling for fuel price and mileage, inspect systems that add load or reduce combustion efficiency.
- Transmission problems: Slipping or incorrect shifting increases engine workload.
- Dragging brakes: A sticking caliper creates continuous resistance.
- Worn or unsuitable tires: Rolling resistance and uneven wear increase fuel demand.
- Engine tune problems: Ignition, airflow, sensor, compression, and fuel delivery faults reduce efficiency.
- Alignment problems: Incorrect toe makes tires scrub instead of roll freely.
How to Build a Fuel Based Maintenance Alert System
A useful alert system defines normal performance, sets a threshold, and connects every serious anomaly to an accountable inspection. Logging exceptions alone does not prevent breakdowns.
Step 1: Establish a Baseline for Every Vehicle
Track MPG, idle percentage, gallons per engine hour, and cost per mile for 30 to 90 days. A fleet reports dashboard can compare each vehicle with its own history and similar assets.
Segment baselines by vehicle class and duty cycle. Delivery vans, pickups, and heavy trucks should not share the same expected MPG.
Step 2: Set Threshold Alerts
Start by flagging a vehicle when MPG, idle fuel, or cost per mile moves more than 5 to 10 percent outside its baseline. Refine the threshold as you learn how season, routes, and loads affect normal variation.
The most useful fuel management system features combine fuel records with mileage and asset context. This helps teams distinguish a mechanical outlier from an operating change.
Step 3: Link Fuel Anomalies to Work Orders
When an alert fires, assign an inspection instead of simply recording the exception. AUTOsist can connect fuel records with fleet maintenance work orders so teams can document the concern, assign responsibility, record findings, and verify the outcome.
Use this extractable workflow:
Frequently Asked Questions
-
Which fuel trend requires the fastest maintenance response?
A sudden fuel consumption spike on one vehicle requires the fastest response, especially when similar vehicles remain stable. Confirm the fuel transaction and mileage data, then inspect for leaks, sensor faults, injector problems, brake drag, or other mechanical issues before returning the vehicle to regular service. -
How can you tell whether poor fuel economy is caused by maintenance or driver behavior?
Compare the vehicle with its own historical baseline and with similar vehicles operating on comparable routes. If MPG remains low across different drivers or continues after route and idle differences are removed, the cause is more likely related to tires, brakes, fluids, sensors, engine performance, or another maintenance issue. -
What percentage change in MPG should trigger a fleet maintenance inspection?
A decline of 5 percent or more from the vehicle's normal MPG is a practical starting point for an alert. Fleets should adjust the threshold by vehicle type, route, season, load, and duty cycle so normal operating variation does not create unnecessary inspections. -
How often should fleet managers review fuel data for maintenance problems?
Fleet managers should review major fuel exceptions weekly and monitor vehicle level trends over rolling 30, 60, and 90 day periods. Weekly checks catch sudden spikes, while longer comparisons reveal gradual efficiency losses that may otherwise go unnoticed. -
What should a fleet do when MPG does not improve after maintenance?
Compare several complete fueling cycles before and after the service while controlling for route, load, weather, and idle time. If performance stays below baseline, reopen the work order and check for incomplete repairs, incorrect parts or fluids, missed diagnostic codes, or a deeper mechanical problem.