Miya Bholat
Jul 17, 2026
How Government Fleets Prioritize Vehicle Replacements?

Government fleets prioritize vehicle replacements by scoring each unit against age, mileage, utilization, maintenance cost, downtime, condition, safety risk, and service impact. A structured fleet management software process turns those inputs into an objective ranking, so limited capital goes first to vehicles that are costly, unreliable, unsafe, or essential to public service. Government vehicles average about 7.4 years old, compared with 3.9 years in the private sector, while approvals and procurement can take 18 to 36 months.
Key Takeaways
- Replacement priority should come from a score. Age, mileage, cost, downtime, condition, and mission impact create a consistent ranking.
- Maintenance cost is only one signal. Repeated downtime can justify replacement even when individual repairs are inexpensive.
- Priority tiers make limited budgets workable. Agencies can separate immediate replacements from scheduled and monitored vehicles.
- Budget approval requires evidence. Cost per mile, maintenance trends, inspections, and retain versus replace comparisons make requests defensible.
- Regulations can change timing. Zero emission purchasing rules may move older fuel powered vehicles forward.
Why Vehicle Replacement Is More Complicated for Government Fleets
A commercial fleet may approve a replacement through one finance team. A government fleet management program may need department approval, procurement review, competitive bidding, finance authorization, council approval, and an audit trail that can withstand public scrutiny.
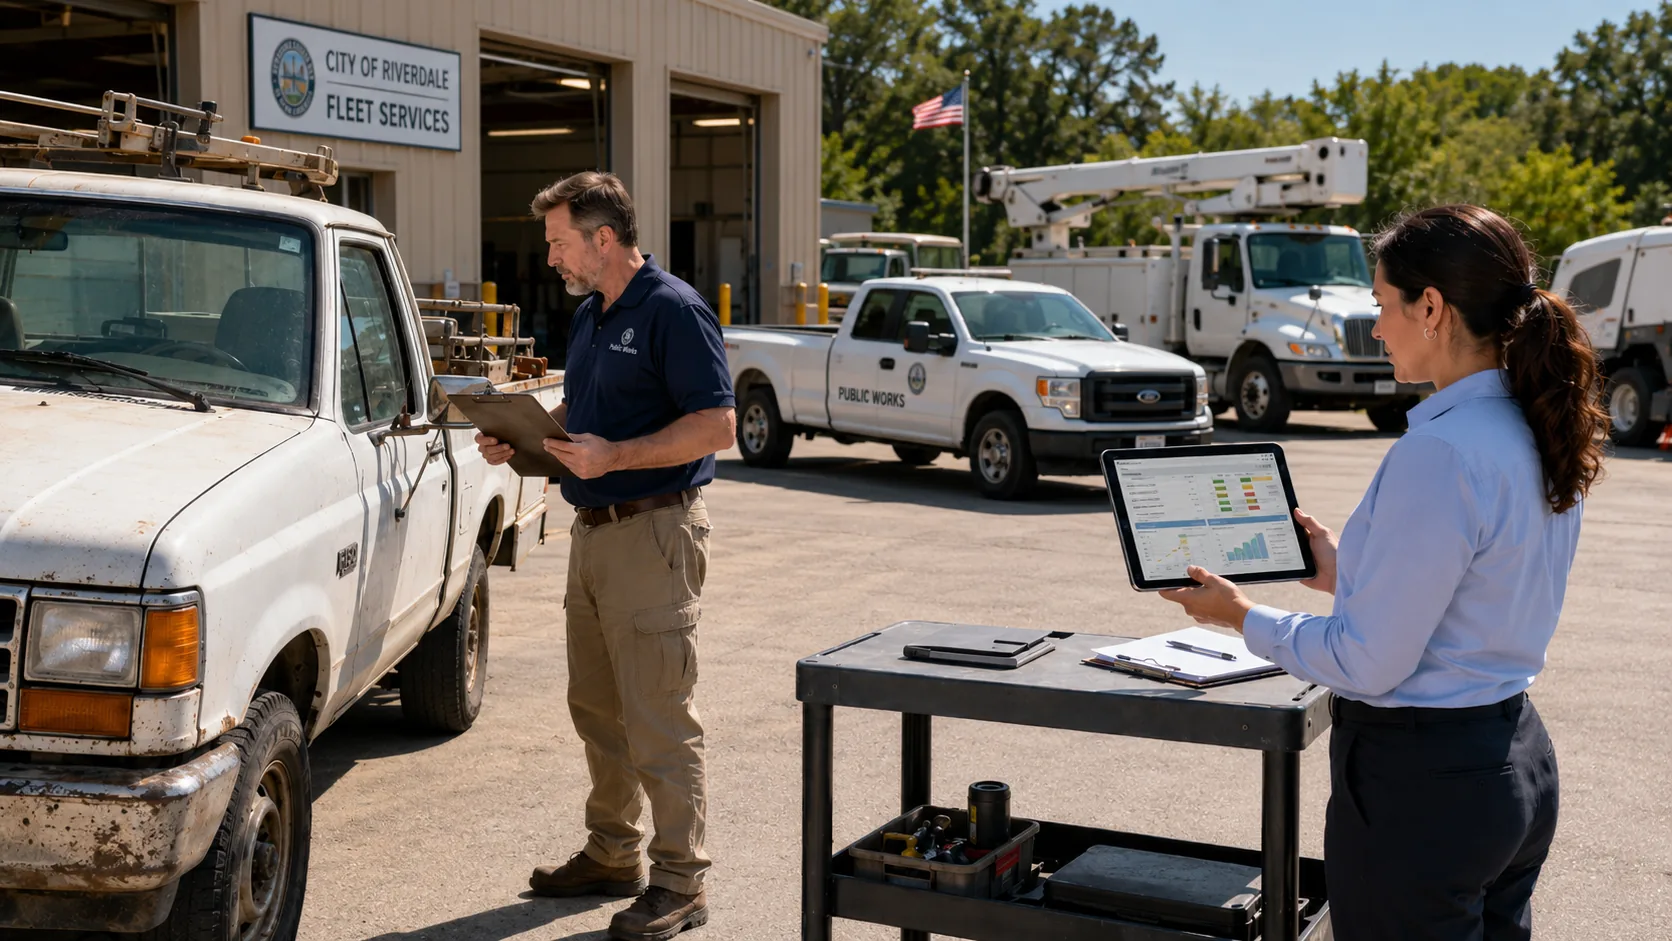
Fleet managers often must identify replacements more than a year before purchase. If the data is weak during budget planning, the request may be deferred while repairs and downtime continue. Modern fleet management software for government fleets helps preserve lifecycle evidence throughout the year instead of rebuilding it during budget season.
The Core Criteria Government Fleets Use to Score Vehicles
Public fleets often use a weighted point system that compares each unit with standards for its class. A patrol SUV, sanitation truck, administrative sedan, and fire apparatus should not share the same expected life or utilization target.
Vehicle Age
Age is measured against the expected service life for the class. A ten year old unit with a twelve year standard is closer to replacement than a four year old unit. Agencies may also set a maximum age that automatically triggers review.
Mileage and Utilization
Mileage should be compared with expected lifecycle mileage. Utilization adds context because low mileage may indicate an underused vehicle rather than a healthy one. Underused units may be reassigned or removed, while heavily used units may need earlier replacement.
Maintenance Cost vs. Acquisition Cost
A vehicle purchased for $40,000 that generated $12,000 in repairs during the last year has consumed 30% of its original purchase price in one year.
Local policies vary. One municipal policy gives its highest maintenance score when repair cost exceeds 25% of purchase cost, while an APWA lifecycle example uses repair cost below 50% as part of the useful life standard. These examples support treating 30% as an early warning and 50% as a serious review point, not universal rules.
A complete vehicle service history shows whether the expense was unusual or part of a recurring pattern.
Downtime and Service Frequency
Downtime deserves a separate score because repair cost can understate operational impact. A vehicle that enters the shop repeatedly may disrupt more work than one unit with a single expensive repair. Fleet maintenance work order software can reveal repeat visits, labor time, parts delays, and days unavailable.
Condition Assessment
A condition inspection adds professional judgment to the score. Agencies can rate mechanical condition, body condition, corrosion, interior wear, safety equipment, and continued duty suitability on a defined scale.
| Scoring input | Example measure | Replacement signal |
|---|---|---|
| Age | Percent of expected service life | Near or beyond class standard |
| Mileage | Percent of lifecycle mileage | Near maximum expected use |
| Maintenance cost | Repair spend as percent of value | Rising annual or cumulative ratio |
| Downtime | Days unavailable and repeat visits | Frequent service interruption |
| Utilization | Miles, hours, or active days | Overuse or chronic underuse |
| Condition | Mechanical and physical score | Poor condition or safety concern |
| Mission impact | Effect on public service | Critical service cannot tolerate failure |
How the USDA Forest Service Built a Smarter Scoring Model
The USDA Forest Service developed the RScore, which combines maintenance cost points, age points, and meter points based on actual versus expected use. An RScore of 15 or higher flags a vehicle for early replacement evaluation.
The model also supports repair approvals. When a high scoring vehicle needs another major repair, the fleet manager can compare repair and replacement before approving more spending. Replacement analysis becomes part of daily workflow instead of only an annual capital exercise.
Tiered Priority Categories: Not Every Vehicle Waits in the Same Line
A final score should place vehicles into action tiers. Prince George's County and other public fleets have used phased programs when funding could not address every overdue unit. One documented catch up program replaced about 15% to 20% of the fleet annually until normal cycles were restored.
- Immediate Replacement: The vehicle exceeds a critical threshold, has a safety concern, creates unacceptable downtime, or supports a service that cannot tolerate failure.
- Scheduled Replacement: The score is high, but the vehicle can remain until the next funded cycle with close monitoring.
- Monitor: The score is moderate and does not justify immediate capital spending, but cost, condition, and utilization require review.
Mission critical vehicles should receive greater service impact weight than administrative pool vehicles. A fleet reports dashboard makes the comparison easier by presenting cost, use, downtime, and repair history together.
Replacement workflow
Building the Business Case: How Fleet Managers Win Budget Approval
A strong score identifies the right vehicle, but the budget package must explain why replacement is responsible. Fleetio's 2026 benchmark data found that vehicles more than 10 years old produced about 34% of service spend while accounting for only 12% of miles.

Cost per mile should show whether the unit is becoming more expensive than comparable vehicles. Downtime should show the routes, shifts, rentals, overtime, or backup assets affected. A retain versus replace analysis should include acquisition, fuel, maintenance, resale proceeds, remaining life, and failure risk.
Evidence summarized in government fleet budget data indicates that every $1 spent on preventive maintenance can avoid about $4 to $8 in emergency repair, towing, and downtime costs. When a vehicle remains expensive despite documented fleet preventive maintenance schedules, replacement becomes easier to defend.
What a Strong Replacement Justification Package Includes
A complete capital request should include:
- Vehicle age, mileage, engine hours, and assigned duty
- A 36 month maintenance cost trend
- Unscheduled downtime and repeat work orders
- Digital vehicle inspection records and unresolved safety concerns
- Current market value and expected disposal proceeds
- Replacement cost and retain versus replace comparison
- Net present value or another approved financial measure
How EV Mandates and Emissions Compliance Are Reshaping Replacement Priorities
New York requires all new school bus purchases to be zero emission beginning in 2027 and targets a fully zero emission school bus fleet by 2035. Its state operations target calls for a 100% zero emission light duty fleet by 2035 and medium and heavy duty fleets by 2040.
California's Advanced Clean Fleets requirements direct state and local agencies to increase zero emission purchases as vehicles are replaced. The adopted schedule began with 50% of applicable annual purchases in 2024 and moves to 100% in 2027, while amendments and flexibility provisions continue to develop.
Some fuel powered units will therefore move higher in the queue because of compliance timing. Managers should compare each candidate with route length, payload, idle time, climate, charging access, emergency needs, and replacement eligibility.
Turning Your Data Into a Replacement Prioritization System
- Define age, mileage, utilization, and maintenance thresholds for every class.
- Score each vehicle quarterly or at least annually.
- Set maximum age, mileage, safety, and repair triggers.
- Place vehicles into Immediate Replacement, Scheduled Replacement, or Monitor tiers.
- Generate budget documentation from actual work orders, inspections, downtime, and costs.
- Track disposal timing and remarketing value to reduce the net capital request.
AUTOsist can centralize the work order history, cost per vehicle, inspection records, downtime information, and reporting inputs that feed this process. That reduces dependence on spreadsheets for fleet management and helps agencies identify fleet performance issues early.
Final Thoughts
Vehicle replacement prioritization is a repeatable system, not a judgment call made when a repair becomes painful. The process compares every unit with class standards, adds service impact and condition, assigns a priority tier, and preserves evidence for public review.
The goal is not to replace the oldest vehicle automatically. It is to replace the unit whose continued operation creates the greatest combined financial, safety, reliability, compliance, and service risk.
Frequently Asked Questions
-
How do government fleets decide which vehicles to replace first?
They score age, mileage, utilization, maintenance cost, downtime, condition, safety risk, and mission impact. Vehicles that exceed critical thresholds or threaten essential service move into the immediate tier. Other units are scheduled or monitored. -
What is a vehicle replacement scoring system?
It assigns points to measurable lifecycle factors and combines them into a total score. The result creates a consistent way to compare units and explain decisions to finance teams, councils, auditors, and department leaders. -
When does it cost more to repair a government vehicle than to replace it?
Review should begin when maintenance cost rises sharply relative to value, especially when downtime and cost per mile also increase. Some agencies use about 30% as an early warning and 50% as a serious review point. The final decision should compare the full annual cost and risk of retention with replacement. -
How do EV mandates affect government fleet replacement priorities?
EV rules can advance replacement timing for eligible fuel powered vehicles. Managers must consider purchase requirements, vehicle availability, charging infrastructure, duty cycle suitability, and procurement lead time. -
What data do fleet managers need to justify a replacement to a city council?
The strongest package includes age, mileage, utilization, 36 month maintenance cost, downtime, inspection history, cost per mile, current value, expected sale proceeds, replacement price, and a retain versus replace comparison. It should also explain the public service risk of delay.