Miya Bholat
Feb 20, 2026
Why Your Fleet Reports Don’t Show the Real Picture — And What to Track Instead

Key Takeaways
-
Lagging indicators explain the past; leading indicators prevent the future.
Tracking fuel spend is helpful, but tracking inspection failures predicts downtime. -
Most reporting gaps are visibility gaps, not data gaps.
Fleets usually collect the right information but fail to surface it in unified reports. -
Disconnected tools create blind spots.
When maintenance, fuel, and inspections stay siloed, managers miss cause-and-effect patterns. -
Predictive metrics reduce emergency costs.
Service interval alerts, repeat repair trends, and idle anomalies directly lower unplanned downtime. -
Reporting cadence matters as much as metrics.
Daily dashboards and automated alerts drive better decisions than monthly summaries alone. -
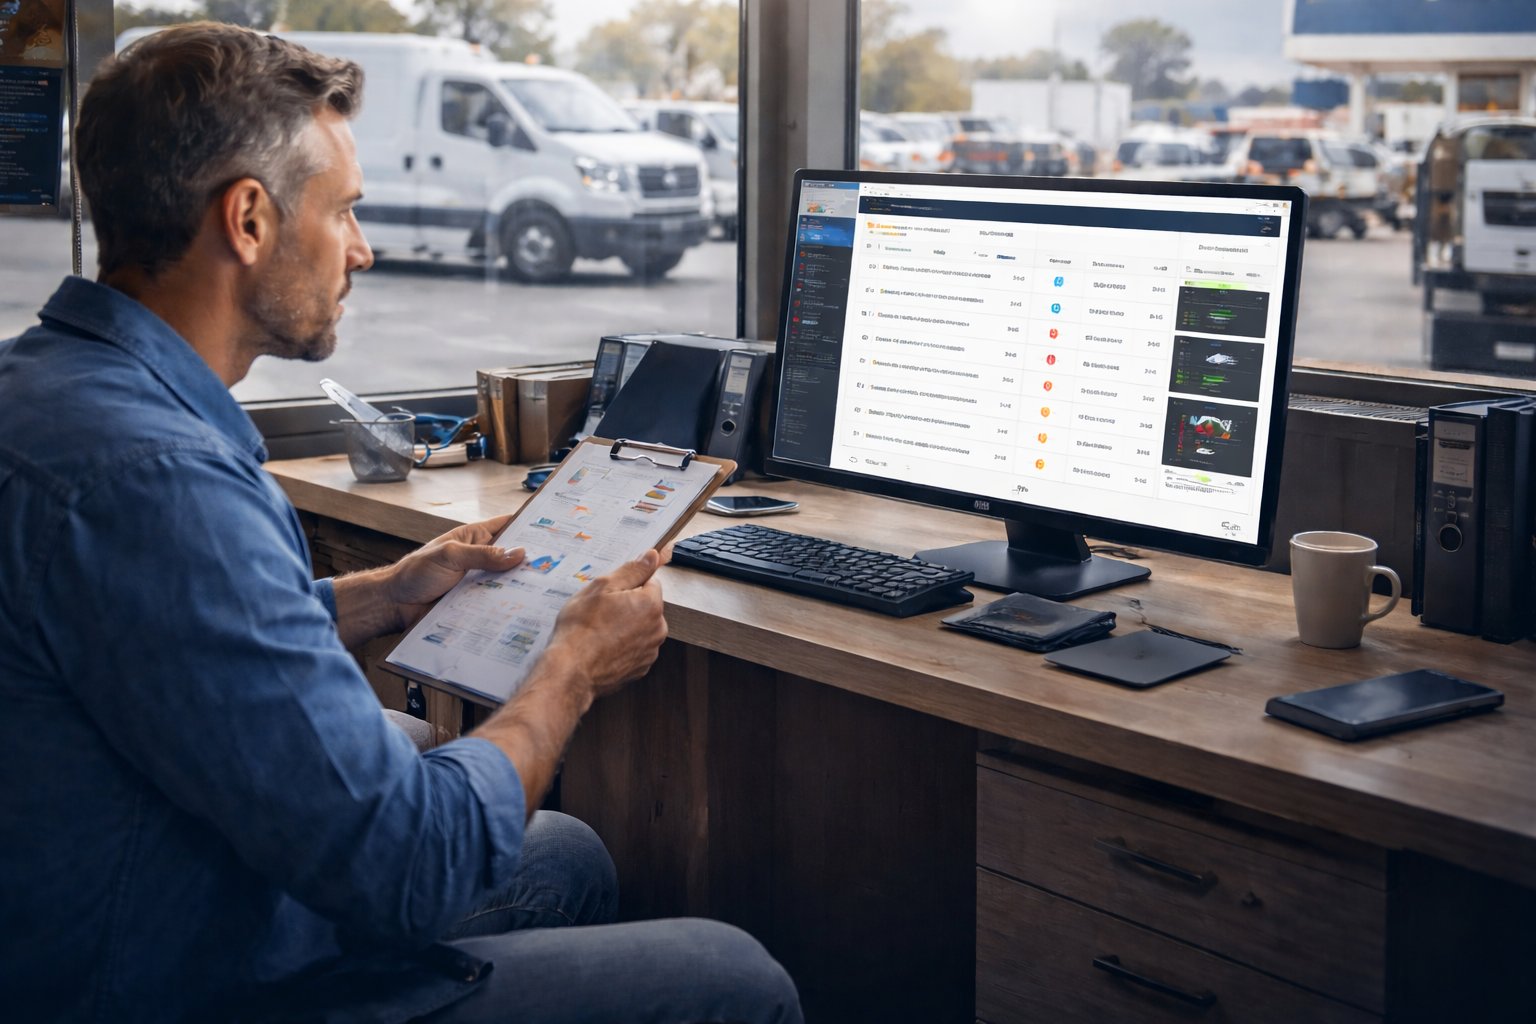
Centralized reporting turns data into action.
When fleets unify inspections, maintenance logs, and dashboards, reports shift from historical records to strategic tools.
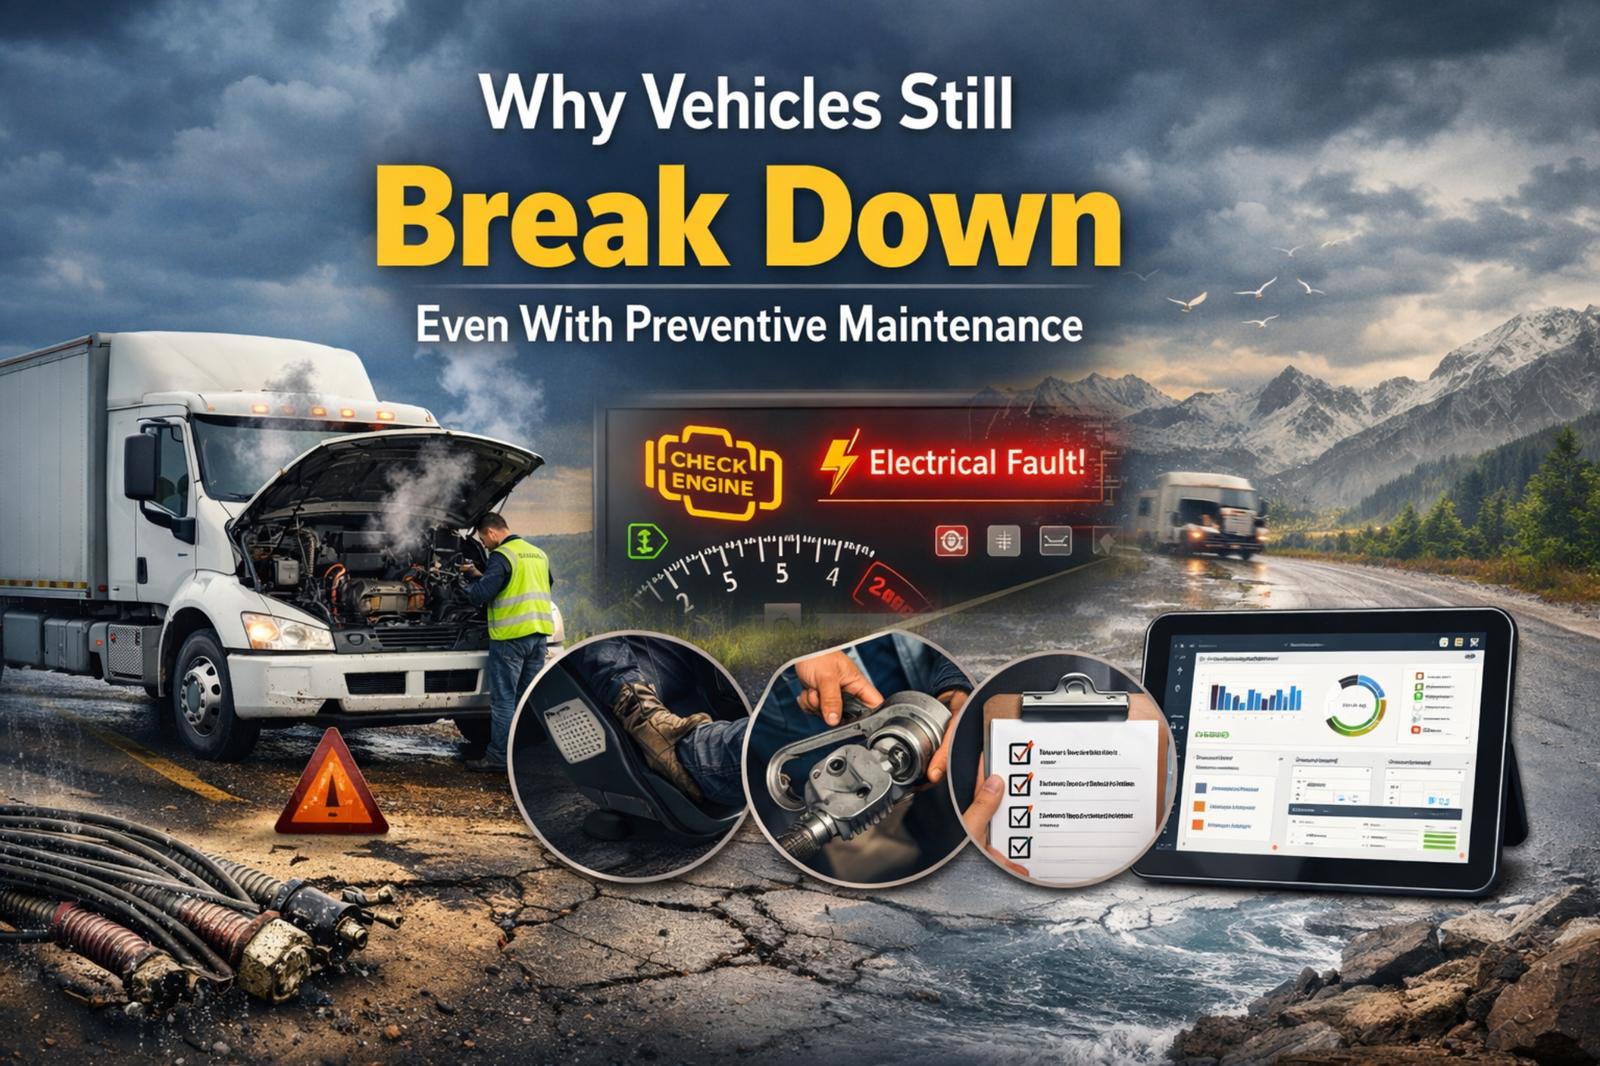
The False Confidence Problem in Fleet Reporting
Most fleet managers have experienced this moment: the monthly report looks clean, fuel spend is within budget, service logs are updated, and utilization seems fine. Then a vehicle breaks down on a critical route or a compliance issue surfaces during an audit. The numbers said everything was under control — reality says otherwise.
The issue is not that fleet managers are careless or that reporting tools are useless. The problem is that most fleet reports measure what is easy to capture, not what is predictive of failure. Reports often show tidy historical data, but they rarely highlight the warning signals hiding beneath the surface.
There is a growing gap between what fleets report and what fleets actually need to see. When reports focus on the past instead of upcoming risks, managers operate with false confidence rather than true visibility.
What Most Fleet Reports Actually Track (And Why It’s Not Enough)
Typical fleet reports revolve around a small set of standard metrics. These include mileage totals, fuel costs, and basic maintenance logs. These numbers are helpful, but they are lagging indicators — they tell you what already happened, not what is about to go wrong.
Common metrics most reports include:
- Monthly fuel spend by vehicle
- Total miles driven
- Completed maintenance tasks
- Service history timestamps
- Vehicle utilization percentages
None of these metrics are useless. The problem is that they rarely answer questions like:
- Which vehicle is most likely to fail next month?
- Which driver behavior is increasing wear and tear?
- Which recurring issue is about to become a major expense?
Lagging vs. Leading Indicators in Fleet Data
Lagging indicators describe past events. Leading indicators predict future outcomes. Most fleet reporting systems default to lagging indicators because they are easier to collect and standardize.
Examples help clarify the difference:
- Lagging: Fuel spend last quarter
- Leading: Sudden spike in idle time across multiple vehicles
- Lagging: Completed brake replacement
- Leading: Repeated brake inspection warnings across similar models
- Lagging: Mileage totals
- Leading: Vehicles approaching service thresholds within 500 miles
Lagging indicators explain history. Leading indicators prevent disasters.
The Data That Gets Left Out
Some of the most valuable fleet insights rarely make it into standard reports. These data points often live in technician notes, spreadsheets, or disconnected systems.
Commonly omitted signals include:
- Inspection failure trends over time
- Repeat repair patterns on the same component
- Technician comments and defect notes
- Parts lifecycle and replacement frequency
- Idle time anomalies
- Driver behavior risk patterns
These signals are the difference between reacting to problems and preventing them.
How Reporting Gaps Translate Into Real Costs
When leading indicators are invisible, fleets operate in reaction mode. The financial consequences compound quickly. Unplanned downtime alone can cost $450–$750 per vehicle per day, depending on the industry and vehicle type. That figure excludes towing fees, overtime labor, missed delivery penalties, and customer dissatisfaction.
Hidden reporting gaps create several cost pressures:
- Emergency repair premiums that exceed planned service costs
- Compliance violations resulting in fines or operational delays
- Accelerated asset depreciation due to unmanaged wear
- Increased insurance risk from repeated incidents
- Lost productivity from unexpected vehicle outages
A single missed pattern — like recurring tire wear or brake inspections — can turn into thousands of dollars in preventable expenses.
The Visibility Problem: Why the Data Exists But Doesn’t Surface
Ironically, many fleets already collect the right data. The issue is not data absence; it is data surfacing. Information lives in multiple tools, notes, and files, but never combines into a unified view. Managers are not blind — they are overloaded with fragmented information.
The frustration often comes from knowing the data exists but being unable to see it clearly when decisions need to be made.
The Spreadsheet Trap
Spreadsheets are powerful tools, but they break down at scale. Many fleets still depend on Excel or Google Sheets for reporting, which introduces predictable failure points:
- Version control confusion
- Manual entry errors
- Formulas that silently break
- Reports that are days or weeks outdated
- No real-time alerts or automation
- Difficulty scaling across multiple locations
Spreadsheets work for small fleets. As fleets grow, they become bottlenecks instead of solutions.
When Your Systems Don’t Talk to Each Other
Disconnected tools create blind spots. Fuel cards, telematics, maintenance logs, and inspection apps often operate independently. A vehicle can show perfect fuel efficiency while hiding severe maintenance risks.
When systems fail to integrate, managers lose the ability to see cause-and-effect relationships across data sources. A unified reporting system — such as a centralized dashboard found in solutions like fleet reports and dashboard — helps eliminate these blind spots by aggregating data into one view.
What a Complete Fleet Report Actually Looks Like
A strong fleet report is not just a summary; it is a predictive tool. It combines historical data with forward-looking signals to guide decisions before issues escalate.
A complete fleet report typically includes:
- Real-time asset health indicators
- Maintenance compliance rates
- Cost-per-mile by vehicle
- Inspection pass/fail trends
- Upcoming service forecasts
- Driver behavior analytics
- Utilization vs. downtime ratios
These metrics provide context, not just numbers. They show where attention is needed before costs spike.
Metrics That Actually Predict Problems
Predictive metrics are the ones that change outcomes. Fleet managers benefit most from tracking signals that highlight risk early.
Examples of leading metrics include:
- Vehicles within 5–10% of service intervals
- Recurring fault codes across the same asset type
- Parts replacement frequency trends
- Inspection failure clustering
- Idle time spikes beyond operational norms
- Maintenance backlog growth rates
These metrics reveal patterns instead of isolated events.
Frequency and Format Matter Too
A powerful metric reported too late is still ineffective. Reporting cadence and delivery format influence decision speed.
Effective reporting practices often include:
- Daily dashboard snapshots for operations teams
- Weekly summary reviews for supervisors
- Monthly strategic reviews for leadership
- Automated alerts for threshold breaches
- Visual dashboards for quick pattern recognition
- Exportable data for audits and compliance
When reporting aligns with decision timing, it becomes a proactive tool rather than a historical archive.
How to Audit Your Current Fleet Reporting
Fleet managers can evaluate their reporting effectiveness without new software or major investments. A simple audit exercise reveals gaps quickly.
Ask these questions this week:
- What decisions does each report actually influence?
- Which reports predict issues versus describe history?
- What data lives outside formal reports?
- Which recurring problems never appear in metrics?
- What would you want to know before the next breakdown?
Comparing current reports to these questions often highlights missing leading indicators. Reviewing resources like a fleet maintenance KPI guide can also help identify measurable performance gaps.
Building a Reporting Setup That Shows the Full Picture
Improving fleet reporting does not require starting from zero. It requires centralization, automation, and alignment with decision-making. The goal is not more data — it is better surfaced data.
Practical improvement steps include:
- Centralizing maintenance, inspection, and fuel data
- Automating service interval alerts
- Aggregating technician notes into reports
- Prioritizing real-time dashboards over static files
- Linking metrics to operational decisions
Solutions that combine maintenance tracking, inspections, and reporting — such as digital vehicle inspection app capabilities alongside integrated dashboards — help fleets surface predictive insights instead of scattered records. Tools discussed in articles like 6 types of fleet management reports also demonstrate how automation reduces manual reporting errors.
The objective is not software adoption for its own sake. The objective is visibility that prevents financial and operational surprises.