 Miya Bholat
Oct 20, 2026
Fleet Fuel Cost by Route: Find Your Most Expensive Routes

Fleet fuel cost by route is the actual fuel expense generated by completing a specific route, based on fuel consumed, distance traveled, vehicle efficiency, idling, and fuel prices. To find your most expensive routes, use fleet fuel management data to calculate fuel cost for each completed route, rank the results, and identify which expenses you can reduce.
A route that covers fewer miles can still consume more fuel than a longer one. The difference often comes from traffic, terrain, vehicle assignments, or time spent idling. Tracking these factors helps fleet managers decide which routes need operational changes and which need more realistic pricing.
Key Takeaways
- Shorter routes are not always cheaper. Traffic, terrain, payload, and idling can make a short route consume more fuel than a longer one.
- Fuel must be attributed to individual routes. Total fleet fuel spending cannot reveal which routes generate unnecessary costs.
- Rank routes by actual fuel expense. Compare cost per completed route, cost per mile, and total spending across repeated trips.
- Separate controllable costs from structural costs. Reduce unnecessary idling, detours, and inefficient vehicle assignments before changing route pricing.
- Find the cause before making changes. Compare vehicle performance, driver behavior, and route conditions to identify the source of excessive consumption.
- Make route cost reviews routine. Monthly comparisons help managers detect recurring fuel waste and measure whether corrective actions work.
Why Distance Alone Lies About Route Cost
Two trucks can travel 100 miles and produce completely different fuel bills.
One maintains a steady highway speed. The other climbs steep grades, makes frequent stops, and spends an hour waiting at customer locations. Although both cover the same distance, their fuel consumption differs.
According to the American Transportation Research Institute's 2026 operational cost research, the average cost of operating a truck reached $2.336 per mile in 2025. Excluding fuel, the figure was $1.854, implying approximately $0.48 per mile in fuel expenses for the surveyed operations. That is an industry benchmark, not a substitute for your fleet's actual costs.
Congestion adds another layer. ATRI's 2024 Cost of Congestion analysis estimated that highway congestion wasted over 6.4 billion gallons of diesel in 2022, adding approximately $32.1 billion in fuel costs.
For last mile delivery fleets, frequent stops, waiting time, and tight delivery windows can make these differences especially important. The actual cost becomes visible only when managers examine what happened during each route.
What Actually Drives Fuel Cost on a Route
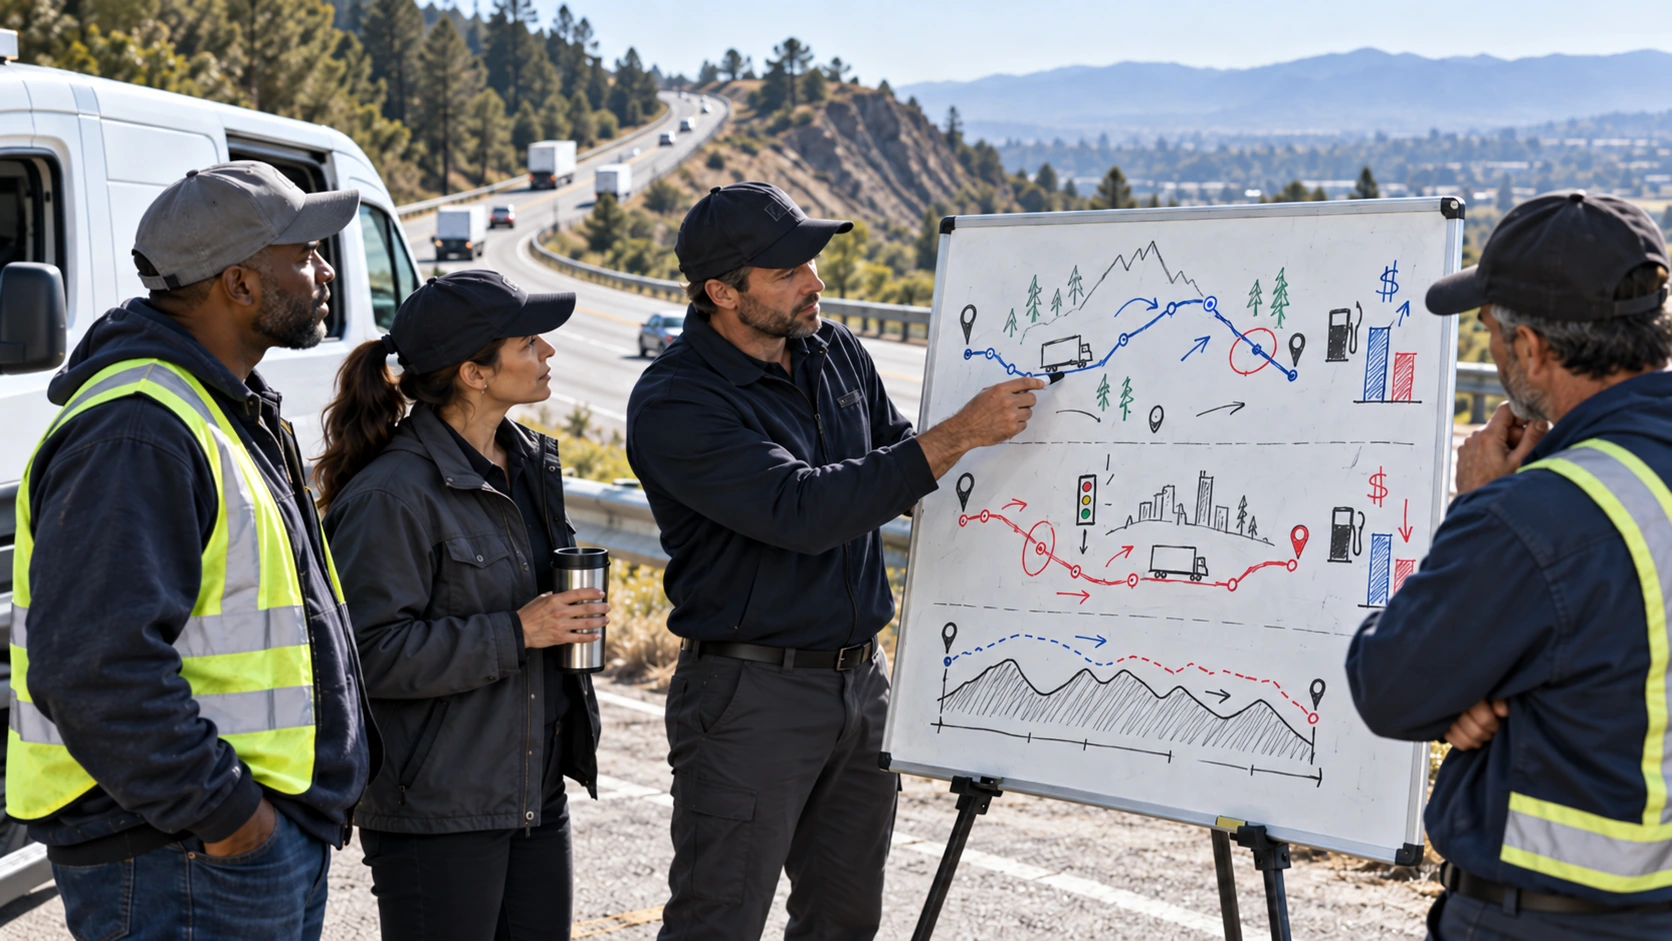
Fuel consumption depends on more than the mileage recorded at the end of a trip. These six factors help explain why otherwise similar routes have different expenses.
| Cost Driver | What It Reveals | Metric to Check |
|---|---|---|
| Terrain and grade | Climbing and elevation changes increase engine demand | Gallons per mile by terrain |
| Congestion | Frequent braking and acceleration increase consumption | Average speed and delay time |
| Idling and dwell | Engines consume fuel without covering distance | Idle hours per route |
| Detours and fueling deviations | Unplanned travel adds unnecessary mileage | Planned vs actual miles |
| Vehicle mismatch | A larger or less efficient vehicle may use more fuel | MPG by vehicle class |
| Load and payload | Heavier loads can increase fuel consumption | Fuel use by payload band |
Detours deserve particular attention. An unexpected road closure may justify extra mileage, while repeated unnecessary deviations can quietly increase costs. Comparing planned routes against actual GPS routes helps establish which differences were operationally necessary.
Managers should also compare conditions across multiple trips. A route that occasionally experiences heavy congestion may need different treatment from one that consistently shows excessive fuel consumption.
Controllable Cost vs Structural Cost
Not every expensive route is inefficient. Some routes cost more because of conditions the fleet cannot reasonably change.
Controllable costs include unnecessary idling, inefficient driving, avoidable detours, poor fueling decisions, and assigning vehicles that consume more fuel than the work requires.
Structural costs include steep terrain, mandatory service stops, unavoidable congestion, regional fuel prices, and geographical distance. Tolls affect total route economics but should remain separate from fuel expenses.
Regional pricing illustrates the distinction. The U.S. Energy Information Administration's 2025 regional gasoline data shows average regular gasoline prices of approximately $2.68 per gallon on the Gulf Coast and $4.09 on the West Coast.
This is why fuel trends across different fleet locations need their own regional comparison. A route should not appear inefficient simply because its operating region has higher fuel prices.
The priority is to eliminate avoidable spending first. If a route remains expensive after operational improvements, managers can adjust its budget or pricing instead of demanding unrealistic fuel savings.
How to Calculate True Fuel Cost per Route
Start with completed routes rather than projected map distances. The following workflow provides a practical way to calculate actual or estimated route fuel expenses.
The core calculation is:
Route Fuel Cost = Route Gallons Consumed × Allocated Fuel Price per Gallon
When consumption occurs at different fuel prices, calculate each portion separately and add the results.
A fleet fuel management system helps organize transaction and fuel expense records. Combine these records with actual route mileage and consumption evidence to avoid treating every fuel purchase as a separate trip expense.
Fuel Cost per Route vs Fuel Cost per Mile
These metrics answer different questions.
Fuel cost per mile measures fuel efficiency in financial terms.
Fuel Cost per Mile = Total Route Fuel Cost ÷ Actual Route Miles
Fuel cost per route measures how much fuel money a particular completed job consumes.
A 200 mile route costing $110 in fuel has a cost of $0.55 per mile. A 90 mile route costing $94.50 has a cost of $1.05 per mile.
The longer route costs more overall, but the shorter route consumes fuel more expensively per mile.
Vehicle selection also matters. When comparing routes, account for why fuel use differs across vehicle types rather than applying one efficiency target to trucks, vans, and service vehicles.
Use cost per mile to investigate efficiency, cost per completed route to evaluate individual jobs, and total monthly route fuel expense to identify where the fleet spends the most money.
The Data You Need to Attribute Fuel to a Route
Reliable route costing requires six inputs: fuel transactions, actual mileage, GPS route history, vehicle class, idle time, and fuel price at purchase.
GPS history identifies the route traveled. Vehicle records provide efficiency context, while fuel transactions establish the monetary cost. Idle time helps explain fuel consumed without corresponding mileage.
Accurate trip and mileage tracking becomes especially important when vehicles complete several routes between refueling stops.
Missing GPS records, inconsistent odometer readings, incomplete fuel transactions, or unreliable MPG figures weaken the calculation. Flag these records as estimates instead of presenting them as verified route costs.
Build Your Most Expensive Routes List
Once every route has a fuel cost, sort the results from highest to lowest. The following example uses illustrative figures for six completed routes.
| Route and Distance | Fuel Cost per Mile | Fuel Cost per Route | Suspected Driver |
|---|---|---|---|
| Route A, 180 miles | $0.85 | $153.00 | Steep grades and payload |
| Route B, 120 miles | $0.99 | $118.80 | Traffic and idling |
| Route C, 220 miles | $0.50 | $110.00 | Long distance |
| Route D, 90 miles | $1.05 | $94.50 | Extended waiting time |
| Route E, 150 miles | $0.55 | $82.50 | Vehicle assignment |
| Route F, 110 miles | $0.60 | $66.00 | Extra mileage |
Route A has the highest fuel cost per completed trip. Route D has the highest cost per mile, making it a stronger candidate for an efficiency investigation.
Also multiply the average fuel cost per run by the number of completed runs. A moderately expensive route repeated every day may create more monthly spending than a costly route completed twice.
A fleet reports dashboard can support these comparisons and help managers monitor fuel expenses alongside mileage and vehicle performance over time.
Diagnosing Why a Route Is Expensive
Once you identify your costliest routes, determine whether the primary problem is the route itself, the vehicle assigned to it, or the way it is driven.
Start with routes that show unusually high fuel cost per mile. Compare recent trips under similar conditions, then examine idle time, average MPG, extra mileage, and vehicle assignments.
Maintenance can also distort route comparisons. Declining fuel economy may indicate developing mechanical issues rather than a route planning problem. Review fuel trends that signal maintenance problems when consumption rises without a matching change in route conditions.
Avoid blaming a driver based on a single expensive trip. Look for repeated patterns across comparable routes and vehicles before drawing conclusions.
When the Route Is the Problem vs When the Vehicle or Driver Is
Use these signals to identify the most likely source of excessive consumption.
| Likely Cause | Evidence | Recommended Action |
|---|---|---|
| Route | Multiple vehicles show high consumption on the same route | Review terrain, stops, congestion, and sequencing |
| Vehicle | One vehicle consistently consumes more fuel on comparable routes | Check vehicle suitability and service history |
| Driver | Consumption changes consistently with the driver under similar conditions | Review idling, acceleration, and driving practices |
A route problem generally follows the route regardless of vehicle or driver. A vehicle problem follows the vehicle across different assignments. A driver related pattern appears across comparable trips after accounting for vehicle and route conditions.
Use GPS tracking and telematics data to investigate route movement, delays, and deviations alongside available fuel and idle records.

Fix or Reprice Your Most Expensive Routes
Start with changes that directly address the diagnosed cost driver.
For congestion and excessive stopping, review stop sequencing and departure windows. For inefficient vehicle assignments, move the work to a suitable vehicle with better fuel economy. For unnecessary idling, address waiting procedures and driver practices. Correct recurring fueling detours when accessible alternatives provide better overall value.
These actions should form part of broader fleet fuel cost control, with savings measured against a comparable baseline rather than assumed from a change in route planning.
Some routes will remain expensive because of mandatory stops, terrain, geography, or service requirements. When operational improvements cannot reduce those expenses, revise customer pricing, fuel surcharges, or internal departmental budgets to reflect the actual cost.
Finally, review route fuel expenses monthly. Track the five most expensive recurring routes, investigate significant cost changes, assign corrective actions, and compare results during the next review. The goal is not simply to identify expensive routes, but to know which ones you can improve and which ones need more realistic pricing.
Frequently Asked Questions
-
How do you split fuel costs when a vehicle completes multiple routes before refueling?
Allocate fuel to each route using actual consumption or recorded mileage and vehicle MPG. Do not assign the entire fuel purchase to the route where the vehicle refueled. -
Can you calculate fleet fuel costs by route without GPS tracking?
Yes. Use trip logs, odometer readings, fuel receipts, and vehicle MPG to estimate route costs. However, GPS and telematics data improve accuracy. -
Should idling fuel consumption count toward route fuel costs?
Yes. Fuel consumed while waiting at delivery locations, loading areas, or in traffic belongs in the route's total fuel expense. -
How do you fairly compare fuel costs between city and highway routes?
Compare similar vehicle classes and workloads using fuel cost per mile, idle time, and cost per completed route. Account for traffic, payload, and required stops. -
When should a fleet manager reprice an expensive route?
Consider repricing when fuel expenses remain high after reducing avoidable idling, detours, and inefficient vehicle assignments. Use repeated route cost data to justify the adjustment.