 Miya Bholat
Nov 04, 2026
Single-Brand vs Universal Fuel Cards for Fleets

Single brand fuel cards offer potentially deeper discounts at a limited network of stations, while universal fuel cards provide broader acceptance with typically smaller rebates. The better choice for your fleet depends on where your vehicles already fuel and which option delivers the lowest total cost per gallon. A reliable fleet fuel management process helps you compare actual fueling locations, discounts, fees, and unnecessary mileage before committing to either network.
The financial stakes are higher in 2026. According to the U.S. Energy Information Administration, on October 26, 2026, average on highway diesel reached $6.352 per gallon, up $2.634 from a year earlier. Regular gasoline averaged $4.269. At those prices, a fuel card decision based only on advertised discounts can leave substantial savings on the table.
Key Takeaways
- Single brand cards prioritize discounts, while universal cards prioritize coverage. The better option depends on whether your regular routes naturally pass eligible stations.
- The biggest advertised discount is not always the cheapest fuel. Pump prices, pricing models, transaction fees, and volume requirements determine actual savings.
- Detours can eliminate fuel card savings. Extra driving, fuel consumption, and driver time may cost more than the discount earned.
- Your transaction history should determine your choice. Reviewing 90 days of fuel purchases reveals which station networks already serve your fleet.
- A hybrid approach can work for mixed fleets. Combining branded and universal cards may reduce costs when local and long distance vehicles have different fueling patterns.
How Single Brand and Universal Fuel Card Networks Work
Fuel card networks determine where drivers can purchase fuel, how discounts apply, and what transaction information managers receive. The distinction matters because a lower advertised price means little if the station is difficult to reach.
Single Brand Fuel Cards: Closed Network, Deeper Discounts
Single brand fuel cards generally operate through a specific oil company or fuel station chain. Drivers receive eligible discounts at participating locations, but acceptance outside that network may be limited or unavailable.
Discounts typically range from a few cents to low double digit cents per gallon, depending on monthly purchase volumes. Smaller fleets may qualify for lower discount tiers.
According to Grand View Research's 2026 Fuel Card Market Report, branded fuel cards held 45.1% of the global market in 2025. Their market share shows that restricted networks remain relevant despite growing interest in broader acceptance.
Universal Fuel Cards: Open Network, Thinner Rebates
Universal fuel cards work across multiple station brands and participating independent locations. Their primary advantage is flexibility, especially when drivers operate across changing routes or unfamiliar areas.
Rebates may be smaller, but drivers can often choose stations based on proximity and pump price. Many programs also support detailed transaction records, driver identification, odometer prompts, and purchase restrictions.
These features can reduce paperwork, although the quality of transaction data still varies by program and station.
Where Merchant and Co Branded Cards Fit
Some station branded cards operate on broader payment networks, making the distinction less obvious. A card may work at many stations while offering its best discounts at one chain.
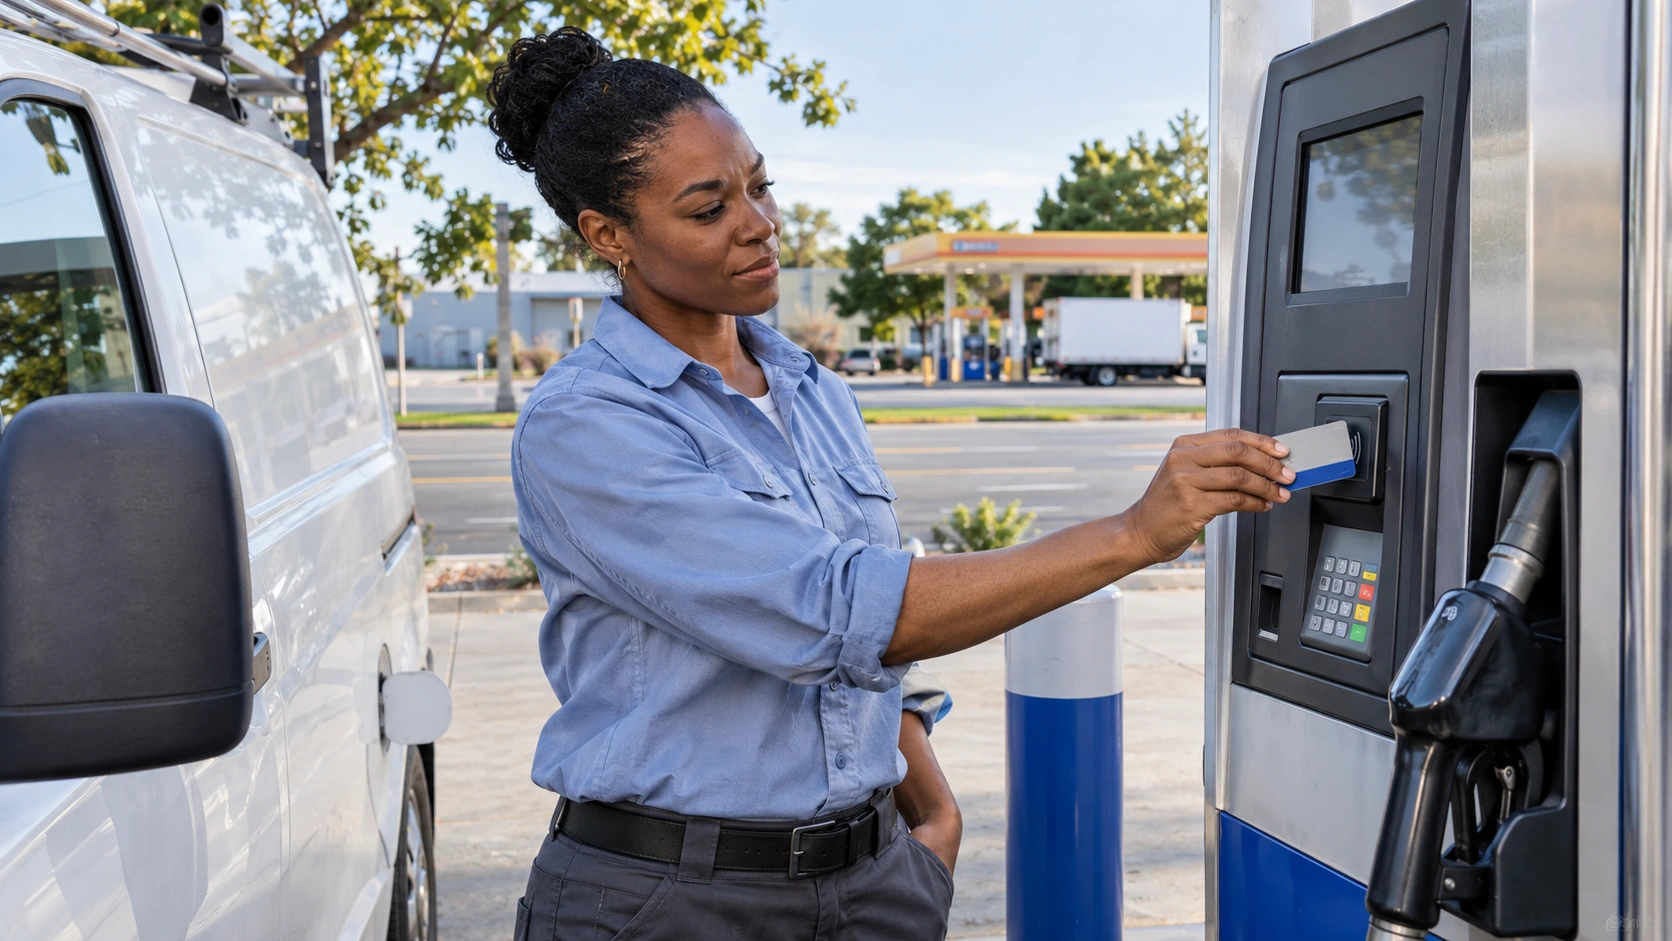
Before comparing offers, ask which locations accept the card, which qualify for rebates, and whether transactions outside the preferred network trigger additional fees.
Single Brand vs Universal Fuel Cards: Side by Side Comparison
The main differences involve network acceptance, discount eligibility, operational flexibility, and transaction reporting.
| Comparison Factor | Single Brand Card | Universal Card |
|---|---|---|
| Acceptance | Primarily one station brand | Multiple brands and participating stations |
| Typical discount structure | Brand specific rebates | Network rebates or negotiated pricing |
| Discount ceiling and volume tiers | Potentially higher, often volume dependent | Usually smaller, varies by program |
| Out of network fees | May apply where outside use is permitted | Depends on network and program |
| Purchase controls | Varies by issuer | Often broad, with configurable limits |
| Transaction data detail | Depends on station and program | Often supports detailed fuel transactions |
| Best fit fleet profile | Predictable local routes | Regional or changing routes |
| Biggest risk | Detours and restricted coverage | Smaller rebates and variable fees |
These are typical program characteristics, not guarantees. A branded card can still cost more if its eligible stations have higher pump prices.
That is why fleet fuel cost control should consider total spending and operating costs instead of treating card rebates as guaranteed savings.
The Real Price Per Gallon: Discounts, Fees, and Detour Costs
The number that matters is what your fleet pays after accounting for pump prices, earned rebates, card fees, and additional operating expenses.
Net cost per gallon = (Total pump spending + card fees + detour fuel cost + detour labor cost less earned rebates) ÷ total gallons purchased.
Retail Minus vs Cost Plus: What the Discount Is Actually Off
Retail minus pricing subtracts an agreed discount from the applicable posted pump price. Cost plus pricing starts from a wholesale fuel benchmark and adds an agreed margin.
Neither model automatically guarantees the lowest price. A larger discount under one model may produce a higher final price under another.
Check whether pricing starts from the cash price or credit price, whether taxes are included, and whether the discount applies at every participating station.
Fees That Quietly Eat the Discount
Request a complete fee schedule before comparing card offers.
- Transaction fees: Charges assessed for individual fuel purchases.
- Monthly card fees: Fixed charges for active cards or accounts.
- Out of network fees: Some published programs allow charges of up to $2 per transaction.
- Late payment fees: Additional costs when payment deadlines are missed.
- Minimum volume requirements: Gallon thresholds needed to qualify for better rebates.
Even modest fees can erase small rebates when vehicles make frequent purchases.
Detour Math: When a Cheaper Gallon Costs More
Example A: Class 8 truck
The American Transportation Research Institute's 2026 operational cost research reported an average truck operating cost of $2.336 per mile in 2025. Average fuel economy was 7.43 MPG.
truckingresearch.org
Consider these assumptions:
- Round trip detour: 10 miles.
- Branded discount: $0.10 per gallon.
- Cost basis: ATRI's average fully allocated operating cost per mile.
The calculation is straightforward:
10 miles × $2.336 = $23.36 in estimated operating cost.
$23.36 ÷ $0.10 = 233.6 gallons required to break even.
A single fill would need approximately 234 gallons just to offset that detour.
This uses average fully allocated operating cost, not the truck's exact incremental cash expense. Actual detour economics depend on fuel, driver time, and other variable costs. Still, it shows why chasing a small discount can be expensive.
Example B: A 20 van service fleet
Assume the following monthly operating conditions:
| Input | Assumption |
|---|---|
| Fleet size | 20 diesel vans |
| Monthly consumption | 2,000 gallons |
| Average fuel price | $6.35 per gallon |
| Average fill | 20 gallons |
| Branded discount | $0.10 per gallon |
| Universal rebate | $0.03 per gallon |
| Natural branded network share | 65% |
| Driver labor cost | $30 per hour |
The branded network already captures 1,300 gallons. Moving the remaining 700 gallons requires 35 additional fueling stops.
Assume each stop adds six miles and 12 minutes, and each van averages 15 MPG.
Branded card calculation:
- Total discount: 2,000 × $0.10 = $200.
- Additional distance: 35 × 6 = 210 miles.
- Additional fuel: 210 ÷ 15 = 14 gallons.
- Additional fuel cost: 14 × $6.35 = $88.90.
- Additional labor: 35 × 12 minutes = 7 hours.
- Labor cost: 7 × $30 = $210.
- Net result: $200 less $298.90 = $98.90 in additional monthly cost.
The universal card earns $60 on the same 2,000 gallons without requiring those detours.
Now change one assumption.
If 95% of gallons are already purchased at eligible branded stations, only 100 gallons need to move. Under the same assumptions, five extra stops cost approximately $42.70.
The branded card then provides about $157.30 in net monthly savings, beating the universal card's $60 rebate.
The lesson is simple: the same discount can win or lose depending on your existing fueling footprint.
This is also why managers should compare fuel spending patterns across fleet locations before assuming one network performs equally well everywhere.
Which Fuel Card Type Fits Your Fleet? A Route Footprint Framework
Your operating pattern is a better starting point than the number of stations advertised by a card provider.
Local Service Fleets With Fixed Territories
Verdict: Consider a single brand card if eligible stations already dominate your routes.
Plumbing, HVAC, landscaping, and municipal service vehicles often travel predictable corridors and return to the same operating areas.

For these service fleet operations, a branded network can work when drivers already pass eligible stations during their regular schedules.
However, verify actual fueling locations before making a decision. A station that looks close on a map may still require an inconvenient turn, additional traffic exposure, or time away from scheduled jobs.
Regional and Multi State Fleets
Verdict: Universal cards generally offer a safer starting point when routes change frequently.
Regional fleets face varying station availability, fuel prices, and route requirements. Restricted networks become harder to justify when drivers regularly cross unfamiliar territory.
ATRI's 2026 report found that 2025 truck fuel costs averaged approximately $0.54 per mile in the West versus $0.45 in the Southeast. EIA data from October 26, 2026, also showed diesel averaging $7.329 on the West Coast compared with $5.890 in the Lower Atlantic region.
For trucking and logistics fleets, geography and station selection can therefore matter considerably more than a small advertised rebate.
Mixed Fleets and Multiple Depots: The Hybrid Option
Verdict: A hybrid setup can work when different vehicle groups have genuinely different fueling needs.
A fleet might use branded cards for local vans and universal cards for vehicles operating across multiple states. This preserves potential discounts without forcing every driver into the same network.
The tradeoff is administrative complexity. Managers must reconcile multiple statements, normalize transaction categories, and apply consistent purchase rules.
A consistent method for reviewing fuel card exceptions helps identify purchases that fall outside expected fueling patterns, regardless of which card drivers use.
How to Audit Your Fuel Data Before You Pick a Network
Use your existing fuel records to determine whether a restricted network offers a measurable advantage.
- Export 90 days of fuel transactions. Include purchase date, vehicle, driver, station, gallons, and total amount.
- Identify station brands and locations. Group transactions by brand and geographic area.
- Calculate natural brand share. Divide gallons already purchased at each brand by total fleet gallons.
- Identify coverage gaps. Find routes and vehicles that rarely use the most common brand.
- Model net cost per gallon. Include pump prices, discounts, card fees, detour fuel, and additional driver time.
- Verify transaction data compatibility. Check driver IDs, odometer readings, product codes, and how records enter your fleet software.
- Run a 60 day pilot. Test one vehicle group before changing the entire fleet.
Practical decision rule: If one brand already captures most of your gallons without detours, request branded pricing. If fueling is distributed across many brands, universal coverage is generally the safer starting point.
AUTOsist's fleet fuel management software helps managers organize fuel records against individual vehicles, making it easier to review consumption and spending before comparing networks.
The audit should also account for changes in driver assignments, seasonal routes, and station availability. A network that performed well during one operating period may not deliver the same savings throughout the year.
Why Card Type Changes the Fuel Data You Can Trust
Fuel card selection affects reporting quality as well as price.
Universal programs may capture detailed transaction information across more participating stations. Restricted networks can create reporting gaps when drivers purchase fuel elsewhere and later submit reimbursement claims.
Missing transactions distort cost per mile and MPG calculations. These gaps make fuel consumption comparisons across vehicles less reliable, especially when vehicles serve different territories.
Before selecting a network, confirm which transaction fields it provides and whether your fleet system supports direct imports or compatible integrations.
Centralized fleet reports and dashboards can help managers compare fuel spending across vehicles and locations, provided transaction records remain complete and correctly assigned.
Switching Fuel Card Types Without Losing Control
A successful transition should preserve purchasing access, transaction visibility, and existing controls while managers validate the new network.
Use this transition checklist:
- Keep existing and replacement cards active for one billing cycle.
- Reapply purchase limits and approved fuel types immediately.
- Reset driver PINs and confirm vehicle assignments.
- Verify station information and odometer prompts.
- Review transaction exceptions after the first 30 days.
Compare actual net cost per gallon during the overlap period. Include missing transactions, fees, and extra travel rather than relying entirely on reported rebates.
The goal is consistent savings across normal operations, supported by broader fleet fuel cost reduction practices.
Frequently Asked Questions
-
Is a branded or universal fuel card cheaper for a small fleet?
A branded card may be cheaper if most vehicles already fuel at its stations. A universal card can offer better overall savings when drivers use multiple brands or frequently change routes. -
Does a universal fuel card give discounts at every gas station?
No. A universal card may be accepted at many stations, but discounts usually apply only at participating locations. Check the eligible discount network separately from the acceptance network. -
Can I use a branded fuel card outside its station network?
Some branded cards allow purchases outside their preferred network, while others do not. Outside purchases may receive no discount or incur additional fees. -
How do I know if a fuel card discount is actually saving money?
Compare the final price per gallon after rebates and fees against nearby alternatives. Include additional fuel and driver time if reaching a discounted station requires a detour. -
Do fuel cards require a minimum number of gallons to get discounts?
Some programs offer better rebates after reaching monthly fuel volume thresholds. Others provide discounts without minimum purchase requirements. Confirm which tier your fleet actually qualifies for.