Miya Bholat
Jul 27, 2026
When Fleet Report Templates Stop Matching Operations
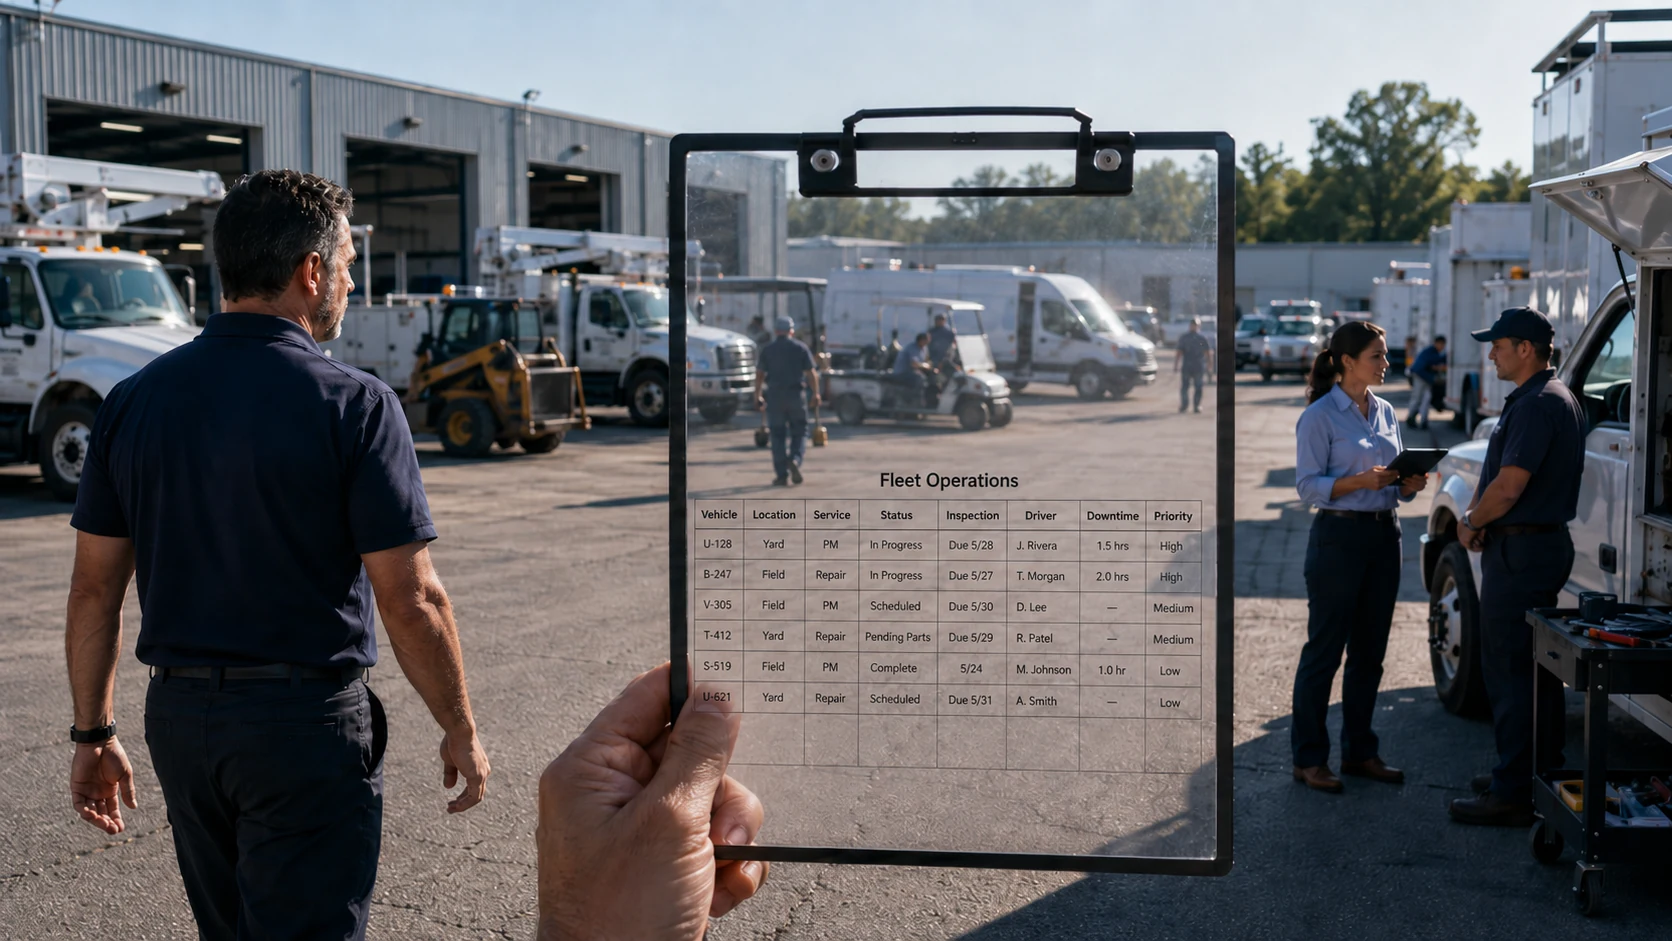
Fleet report templates stop matching operations when the fleet changes but the fields, filters, categories, and calculations inside its reports remain frozen. The solution is to compare every template with current operating conditions and remove, replace, or add fields based on the decisions the fleet now needs to make. A centralized fleet management software platform can make that review easier by keeping maintenance, cost, driver, asset, and inspection information in one connected system.
Key Takeaways
- Clean data can still produce an unhelpful report. A report may contain accurate information while failing to answer the questions leadership and operations teams currently ask.
- Operational changes create reporting gaps. New vehicles, locations, service categories, routes, regulations, and cost structures can make an old template incomplete.
- Manual workarounds are a warning sign. Side spreadsheets, emailed explanations, and verbal summaries usually mean the official report no longer reflects the operation.
- Every report field should support a decision. Columns and metrics that no longer influence an active decision should be reviewed or removed.
- Template ownership prevents silent drift. Someone should be responsible for reviewing report structures whenever the fleet changes.
- Regular audits keep reports useful. A quarterly review helps ensure templates still reflect the fleet profile, leadership priorities, and compliance obligations.
Why Fleet Reports Start Feeling Useless Even When the Data Is Clean
A familiar reporting problem starts with a report that runs correctly but does not answer the question being discussed. Leadership asks why maintenance spending increased, but the report only shows total repair cost. Operations asks which location is losing the most vehicle availability, but the template has no location field. Finance asks whether aging vehicles are driving cost growth, but age and lifecycle stage are missing.
This is not always a data quality problem. The data may be complete and accurate within the limits of the template. The real issue is structural: the report was designed around an earlier version of the operation.
A template built when the fleet had 25 similar vehicles at one location may have worked well. After the fleet grows to 60 vehicles across three locations, the same columns and filters may hide meaningful differences. Managers then spend time combining reports, checking individual records, and explaining why the totals do not match what teams experience in the field.
This gap can also make fleet data inconsistent across teams because each department begins creating its own version of operational truth.
What Template Operations Drift Actually Looks Like
Template operations drift is the growing difference between what a report was designed to describe and how the fleet currently operates. It usually appears through small workarounds rather than one obvious failure.
Common symptoms include:
- Leaders repeatedly asking for information that is absent from the report
- Managers exporting data and adding columns before every meeting
- Different locations maintaining separate versions of the same template
- Important exceptions being explained through email or verbal updates
- Reports containing fields that nobody reviews
- Totals that require additional context before anyone trusts them
Fields That Track Metrics Nobody Uses Anymore
Old fields survive because removing them feels risky. A fleet may continue reporting cost per gallon even after fuel card data has made fuel volume, idle use, and cost per mile more relevant. Another template may still separate a vehicle class that has almost completely disappeared from the fleet.
These fields make reports longer without making them more useful. They also distract reviewers from information connected to current decisions. A fleet management dashboard metrics framework can help distinguish between metrics that look familiar and metrics that actually influence maintenance, utilization, safety, or replacement decisions.
Missing Columns for What the Fleet Does Now
Missing fields often create more damage than outdated fields. A fleet may add electric vehicles without adding charging cost and charging downtime categories. A construction company may expand into heavy equipment but continue using a vehicle only service template. A public agency may face a new audit requirement without adding the documentation status needed to verify compliance.
A template should reflect the current fleet profile, including:
| Operational change | Report structure that may be needed | Decision supported |
|---|---|---|
| New vehicle type | Asset class and service requirement | Compare maintenance needs |
| Additional location | Branch, yard, or department field | Identify local cost differences |
| New compliance rule | Inspection or document status | Confirm audit readiness |
| Expanded service territory | Route or service area | Compare utilization |
| New cost category | Separate expense classification | Explain budget changes |
| Leadership change | Revised summary metrics | Answer new priorities |
For example, a construction fleet operation may need to separate road vehicles, trailers, and jobsite equipment because each asset category follows a different utilization and maintenance pattern.
Manual Workarounds That Replace the Report
The clearest sign of drift is when the official report becomes only the starting point. Managers export it, correct categories, add missing information, and create another spreadsheet that leadership actually sees.

The same problem appears when supervisors email explanations such as "Vehicle 32 looks underused because it was reassigned" or "The maintenance increase includes a new equipment category." Those explanations belong in the reporting structure, not in a message that may disappear.
When updates routinely get lost between departments, the organization may also need to examine how fleet information moves between teams, not only the template itself.
Why Report Templates Go Stale Without Anyone Noticing
Templates rarely become useless overnight. They fall behind through a sequence of small operational changes.
The Template Was Built for a Different Fleet
Fleet size, vehicle mix, service territory, ownership model, and maintenance strategy can all change. The report may remain untouched because it still opens, calculates totals, and produces familiar charts.
A fleet that expands into multiple branches needs reporting by location. A fleet that begins outsourcing part of its maintenance needs to separate internal and vendor work. A fleet that grows beyond manual coordination may need to reconsider how operations are managed across multiple locations.
The Person Who Built It Left
The original template designer may have understood why a field was included, how a filter worked, or which records needed manual adjustment. When that person leaves or changes roles, the template remains but the reasoning behind it disappears.
The next manager often avoids changing the structure because nobody can confirm which parts are essential. Over time, the report becomes an inherited routine rather than a deliberately designed management tool.
Templates Get Copied, Not Designed
Many templates begin as software defaults, files from another department, or spreadsheets borrowed from another company. Copying saves setup time, but the resulting structure reflects someone else's fleet.
A school bus operation, for example, may prioritize route completion, inspection status, and spare bus availability. A trucking and logistics fleet may care more about mileage, driver assignment, fuel performance, and long distance service intervals. One template cannot represent both operations equally well without customization.
The Real Cost of Running Reports That Do Not Match Your Operation
A mismatched report increases administrative work and weakens decisions. Managers spend time reconciling totals, finding missing context, rebuilding charts, and confirming whether an apparent problem is real.
The consequences often include:
- Delayed maintenance approvals
- Poor visibility into high cost assets
- Incorrect vehicle replacement priorities
- Missed compliance documentation
- Repeated questions from leadership
- Lower trust in fleet data
- More dependence on personal knowledge
Industry estimates put average fleet downtime losses somewhere around $448 to $760 per vehicle per day, though the actual number depends heavily on the fleet and how it operates. There are also estimates suggesting that average fleets lose roughly 5 to 10 percent of their annual budgeted dollars to inefficiencies like poor utilization, over-speccing vehicles, and falling behind on maintenance compliance.
These figures do not mean every reporting gap directly creates that level of loss. They show why missing maintenance, utilization, and cost signals can become expensive when reports delay action. A manager who cannot see recurring downtime by asset class may approve repeated repairs without recognizing a replacement problem.
The cost compounds each month because decisions based on incomplete structure create new records inside the same incomplete structure.
Template drift cost workflow:
How to Audit Your Fleet Report Templates Against Current Operations
A template audit should start with decisions, not formatting. The goal is not to make reports more attractive. It is to verify that each report describes the operation accurately enough to support action.
Start With What Leadership Actually Asks For
Review questions raised during budget meetings, maintenance reviews, safety discussions, and replacement planning. Compare those questions with what the report produces without additional research.
A useful audit worksheet can include:
| Leadership question | Available in report | Outside work required | Template action |
|---|---|---|---|
| Which vehicles drive repair cost? | Partly | Service history review | Add cost by asset |
| Which location has most downtime? | No | Separate spreadsheet | Add location field |
| Are inspections completed? | Yes | None | Keep current field |
| Which assets should be replaced? | Partly | Manual age comparison | Add age and lifecycle data |
After reviewing a report, managers should also follow a consistent fleet report action process so findings lead to ownership, deadlines, and operational changes.
Map Every Field to an Active Decision
Review each column, metric, filter, and grouping. Ask which decision it supports and who uses it. A field without a current purpose may be outdated, while a recurring question with no corresponding field reveals a gap.
Use this simple classification:
- Keep: The field supports a current decision.
- Revise: The field is useful but needs a new definition or category.
- Remove: The field no longer affects a decision.
- Add: A current decision requires information the template does not capture.
- Validate: The field matters, but teams interpret or enter it differently.
Check the Template Against Your Current Fleet Profile
Compare the report with the fleet as it exists today. Review vehicle count, asset types, locations, driver structure, service categories, compliance requirements, vendors, cost classifications, and replacement criteria.

Use records from the vehicle service history system to confirm whether report categories reflect the maintenance work actually being completed. Inspection and documentation fields should also align with the fleet's current vehicle document management process.
Building Report Templates That Evolve With Your Fleet
Report templates should be treated as operational tools, not permanent forms. Review them at least quarterly and whenever the fleet adds a location, introduces a new asset type, changes maintenance processes, adopts new compliance requirements, or receives different reporting expectations from leadership.
Assign one owner who can approve structural updates and document why fields were added or removed. The owner should collect input from maintenance, operations, finance, safety, and leadership without allowing every team to create a separate report.
A practical review workflow is:
Centralized fleet reports and dashboard views make this process easier because teams can adjust report structures without rebuilding disconnected spreadsheets. Automated distribution can help after the template is corrected, but automated fleet reporting cannot fix a structure that measures the wrong things.
Frequently Asked Questions
-
How do I know if my fleet reports are outdated?
Your reports are probably outdated when managers repeatedly add columns, build side spreadsheets, or explain missing context outside the official report. Frequent leadership questions that the report cannot answer are another clear warning. -
Why do fleet report templates stop working?
Templates stop working because operations change while report fields and filters remain fixed. Growth, new vehicle types, additional locations, compliance changes, and new leadership priorities can all create misalignment. -
How often should fleet report templates be reviewed?
Review templates at least quarterly. You should also review them immediately after a significant change in fleet size, asset mix, locations, compliance requirements, service processes, or management priorities. -
Should every field in a fleet report connect to a decision?
Yes. Every field should support a current operational, financial, maintenance, safety, compliance, or replacement decision. Fields without a clear use add noise and may hide more important information. -
Can automated reporting fix an outdated template?
Automation can distribute and refresh a report faster, but it cannot correct an outdated structure by itself. The fleet must first update the fields, filters, definitions, and groupings so the automated report reflects current operations.